Concept explainers
Bone Density Test. In Exercises 1–4, assume that scores on a bone mineral density test are
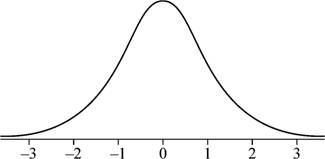
1. Bone Density Sketch a graph showing the shape of the distribution of bone density test scores.
To sketch: The graph showing the shape of the distribution of the bone mineral density test scores.
Answer to Problem 1CQQ

Explanation of Solution
Given info:
The bone density test scores follow a normal distribution with mean of 0 and standard deviation of 1.
Justification:
Here, the bone density test follows a normal distribution. Also, the graph of the normal distribution is bell shaped and is symmetric about the mean. Moreover, if the mean and standard deviation are 0 and 1, respectively, the distribution is known as standard normal distribution. Hence, the graph of the bone density test scores is bell-shaped
Want to see more full solutions like this?
Chapter 6 Solutions
Elementary Statistics, Books A La Carte Edition (13th Edition)
- 19. Let X be a non-negative random variable. Show that lim nE (IX >n)) = 0. E lim (x)-0. = >arrow_forward(c) Utilize Fubini's Theorem to demonstrate that E(X)= = (1- F(x))dx.arrow_forward(c) Describe the positive and negative parts of a random variable. How is the integral defined for a general random variable using these components?arrow_forward
- 26. (a) Provide an example where X, X but E(X,) does not converge to E(X).arrow_forward(b) Demonstrate that if X and Y are independent, then it follows that E(XY) E(X)E(Y);arrow_forward(d) Under what conditions do we say that a random variable X is integrable, specifically when (i) X is a non-negative random variable and (ii) when X is a general random variable?arrow_forward
 Big Ideas Math A Bridge To Success Algebra 1: Stu...AlgebraISBN:9781680331141Author:HOUGHTON MIFFLIN HARCOURTPublisher:Houghton Mifflin Harcourt
 Glencoe Algebra 1, Student Edition, 9780079039897...AlgebraISBN:9780079039897Author:CarterPublisher:McGraw Hill

