Concept explainers
Videos
To write:
A script that will prompt the user to enter the coordinates of three points that determine a triangle, then calculate and print the area of the triangle and then call one
Answer to Problem 19E
Solution:
The script file is,
% MATLAB code to calculate the area of the triangle by calling a function.
%script file.
x1 = input('the x coordinate of the fist point is entered:');
%enter the x coordinate of the first point.
x2 = input('the x coordinate of the second point is entered:');
%enter the x coordinate of the second point.
x3 = input('the x coordinate of the third point is entered:');
%enter the x coordinate of the third point.
y1 = input('the y coordinate of the fist point is entered:');
%enter the y coordinate of the first point.
y2 = input('the y coordinate of the second point is entered:');
%enter the y coordinate of the second point.
y3 = input('the y coordinate of the third point is entered:');
%enter the y coordinate of the third point.
Area = trianglearea(x1, y1, x2, y2, x3, y3);
fprintf('The triangle’’s area is %.2f\n', Area)
% end of script file
%The script file should be placed in the same folder.
The function file is,
% MATLAB code to calculate the area of the triangle.
%function file.
function out = trianglearea(x1, y1, x2, y2, x3, y3)
%define the area of triangle by using the function areatriangle.
a = sidetriangle(x1, y1, x2, y2);
%define the variable a.
b = sidetriangle(x2, y2, x3, y3);
%define the variable b.
c = sidetriangle(x3, y3, x1, y1);
%define the variable c.
s = (a+b+c)/2;
%define the variable s.
out = sqrt (s*(s-a)*(s-b)*(s-c));
end
function out2 = sidetriangle(x1, y1, x2, y2)
%calculate the distnace between the two points by calling a function
%sidetriangle.
out2 = sqrt((x1-x2)^2 + (y1-y2)^2);
%calculate the sides of the triangle.
end
% end of function
%The function file should be placed in the same folder.
Explanation of Solution
The given two points are
The formula of the distance between the two points is given as,
Substitute 0 for
Consider the three points are
The side of the triangle is,
Substitute 0 for
The side of the triangle is,
Substitute 5 for
The side of the triangle is,
Substitute 5 for
The formula for half sum of the sides of the triangle is,
Substitute 5 for a, 5 for b and
The formula for the area of the triangle is,
Substitute 5 for a, 5 for b,
MATLAB Code:
% MATLAB code to calculate the area of the triangle by calling a function.
%script file.
x1 = input('the x coordinate of the fist point is entered:');
%enter the x coordinate of the first point.
x2 = input('the x coordinate of the second point is entered:');
%enter the x coordinate of the second point.
x3 = input('the x coordinate of the third point is entered:');
%enter the x coordinate of the third point.
y1 = input('the y coordinate of the fist point is entered:');
%enter the y coordinate of the first point.
y2 = input('the y coordinate of the second point is entered:');
%enter the y coordinate of the second point.
y3 = input('the y coordinate of the third point is entered:');
%enter the y coordinate of the third point.
Area = trianglearea(x1, y1, x2, y2, x3, y3);
fprintf('The triangle’’s area is %.2f\n', Area)
% end of script file
%The script file should be placed in the same folder.
% MATLAB code to calculate the area of the triangle.
%function file.
function out = trianglearea(x1, y1, x2, y2, x3, y3)
%define the area of triangle by using the function areatriangle.
a = sidetriangle(x1, y1, x2, y2);
%define the variable a.
b = sidetriangle(x2, y2, x3, y3);
%define the variable b.
c = sidetriangle(x3, y3, x1, y1);
%define the variable c.
s = (a+b+c)/2;
%define the variable s.
out = sqrt (s*(s-a)*(s-b)*(s-c));
end
function out2 = sidetriangle(x1, y1, x2, y2)
%calculate the distnace between the two points by calling a function
%sidetriangle.
out2 = sqrt((x1-x2)^2 + (y1-y2)^2);
%calculate the sides of the triangle.
end
% end of function
%The function file should be placed in the same folder.
Save the MATLAB script with name, mainscript.m, and the function file is trianglearea.m in the current folder. Execute the program by typing the script name at the command window to generate result.
Result:
The output is,
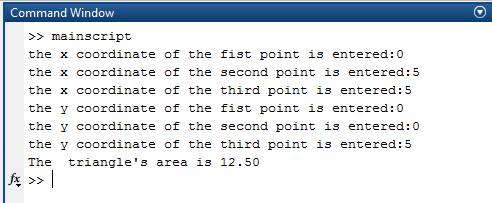
Therefore, the result is stated above.
Want to see more full solutions like this?
Chapter 6 Solutions
Matlab, Fourth Edition: A Practical Introduction to Programming and Problem Solving


- Analyze the residuals of a linear regression model and select the best response. yes, the residual plot does not show a curve no, the residual plot shows a curve yes, the residual plot shows a curve no, the residual plot does not show a curve I answered, "No, the residual plot shows a curve." (and this was incorrect). I am not sure why I keep getting these wrong when the answer seems obvious. Please help me understand what the yes and no references in the answer.arrow_forwarda. Find the value of A.b. Find pX(x) and py(y).c. Find pX|y(x|y) and py|X(y|x)d. Are x and y independent? Why or why not?arrow_forwardAnalyze the residuals of a linear regression model and select the best response.Criteria is simple evaluation of possible indications of an exponential model vs. linear model) no, the residual plot does not show a curve yes, the residual plot does not show a curve yes, the residual plot shows a curve no, the residual plot shows a curve I selected: yes, the residual plot shows a curve and it is INCORRECT. Can u help me understand why?arrow_forward
- You have been hired as an intern to run analyses on the data and report the results back to Sarah; the five questions that Sarah needs you to address are given below. please do it step by step on excel Does there appear to be a positive or negative relationship between price and screen size? Use a scatter plot to examine the relationship. Determine and interpret the correlation coefficient between the two variables. In your interpretation, discuss the direction of the relationship (positive, negative, or zero relationship). Also discuss the strength of the relationship. Estimate the relationship between screen size and price using a simple linear regression model and interpret the estimated coefficients. (In your interpretation, tell the dollar amount by which price will change for each unit of increase in screen size). Include the manufacturer dummy variable (Samsung=1, 0 otherwise) and estimate the relationship between screen size, price and manufacturer dummy as a multiple…arrow_forwardHere is data with as the response variable. x y54.4 19.124.9 99.334.5 9.476.6 0.359.4 4.554.4 0.139.2 56.354 15.773.8 9-156.1 319.2Make a scatter plot of this data. Which point is an outlier? Enter as an ordered pair, e.g., (x,y). (x,y)= Find the regression equation for the data set without the outlier. Enter the equation of the form mx+b rounded to three decimal places. y_wo= Find the regression equation for the data set with the outlier. Enter the equation of the form mx+b rounded to three decimal places. y_w=arrow_forwardYou have been hired as an intern to run analyses on the data and report the results back to Sarah; the five questions that Sarah needs you to address are given below. please do it step by step Does there appear to be a positive or negative relationship between price and screen size? Use a scatter plot to examine the relationship. Determine and interpret the correlation coefficient between the two variables. In your interpretation, discuss the direction of the relationship (positive, negative, or zero relationship). Also discuss the strength of the relationship. Estimate the relationship between screen size and price using a simple linear regression model and interpret the estimated coefficients. (In your interpretation, tell the dollar amount by which price will change for each unit of increase in screen size). Include the manufacturer dummy variable (Samsung=1, 0 otherwise) and estimate the relationship between screen size, price and manufacturer dummy as a multiple linear…arrow_forward
- Exercises: Find all the whole number solutions of the congruence equation. 1. 3x 8 mod 11 2. 2x+3= 8 mod 12 3. 3x+12= 7 mod 10 4. 4x+6= 5 mod 8 5. 5x+3= 8 mod 12arrow_forwardScenario Sales of products by color follow a peculiar, but predictable, pattern that determines how many units will sell in any given year. This pattern is shown below Product Color 1995 1996 1997 Red 28 42 21 1998 23 1999 29 2000 2001 2002 Unit Sales 2003 2004 15 8 4 2 1 2005 2006 discontinued Green 26 39 20 22 28 14 7 4 2 White 43 65 33 36 45 23 12 Brown 58 87 44 48 60 Yellow 37 56 28 31 Black 28 42 21 Orange 19 29 Purple Total 28 42 21 49 68 78 95 123 176 181 164 127 24 179 Questions A) Which color will sell the most units in 2007? B) Which color will sell the most units combined in the 2007 to 2009 period? Please show all your analysis, leave formulas in cells, and specify any assumptions you make.arrow_forwardOne hundred students were surveyed about their preference between dogs and cats. The following two-way table displays data for the sample of students who responded to the survey. Preference Male Female TOTAL Prefers dogs \[36\] \[20\] \[56\] Prefers cats \[10\] \[26\] \[36\] No preference \[2\] \[6\] \[8\] TOTAL \[48\] \[52\] \[100\] problem 1 Find the probability that a randomly selected student prefers dogs.Enter your answer as a fraction or decimal. \[P\left(\text{prefers dogs}\right)=\] Incorrect Check Hide explanation Preference Male Female TOTAL Prefers dogs \[\blueD{36}\] \[\blueD{20}\] \[\blueE{56}\] Prefers cats \[10\] \[26\] \[36\] No preference \[2\] \[6\] \[8\] TOTAL \[48\] \[52\] \[100\] There were \[\blueE{56}\] students in the sample who preferred dogs out of \[100\] total students.arrow_forward
 Trigonometry (MindTap Course List)TrigonometryISBN:9781337278461Author:Ron LarsonPublisher:Cengage Learning
 Elementary AlgebraAlgebraISBN:9780998625713Author:Lynn Marecek, MaryAnne Anthony-SmithPublisher:OpenStax - Rice University
 College AlgebraAlgebraISBN:9781305115545Author:James Stewart, Lothar Redlin, Saleem WatsonPublisher:Cengage Learning
 Holt Mcdougal Larson Pre-algebra: Student Edition...AlgebraISBN:9780547587776Author:HOLT MCDOUGALPublisher:HOLT MCDOUGAL
 Algebra & Trigonometry with Analytic GeometryAlgebraISBN:9781133382119Author:SwokowskiPublisher:Cengage