Concept explainers
Videos
To write:
A program to convert the Cartesian coordinates to spherical coordinates, and print the results.
Answer to Problem 15E
Solution:
The script file is,
% MATLAB code to print the result in spherical coordinates.
%script file.
[x, y, z] = getcartesian();
%get the value of cartesian coordinates by calling the
%getcartesian.
printspherical(x, y, z)
%print the value in spherical coordinates by calling the function
%printspherical.
% end of script
%The script file should be placed in the same folder.
The function file is,
% MATLAB code to get the result in cartesian coordinates.
%Function file.
function [x, y, z] = getcartesian()
%get the cartesian coordinates by using the function getcartesian.
x = 1;
%define the variable x.
y = 2;
%define the variable y.
z = 3;
%define the variable z.
end
% end of function
%The function file should be placed in the same folder.
The function file is,
% MATLAB code to print the result in spherical coordinates.
%Function file.
function printspherical(x, y, z)
%the spherical coordinates will be printed by using the function
%printspherical.
[rad, incl, azi] = convert2spher(x, y, z);
%convert the spherical coordinates to cartesian coordionates.
fprintf('the radius is %.2f\n', rad);
%print the radius.
fprintf('the inclination angle is %.2f\n', incl);
%print the inclination angle.
fprintf('the azimuth angle is %.4f\n', azi);
%print the azimuth.
end
% end of function
function [ra, in, a] = convert2spher(x, y, z)
%call a subfunction convert2spher to transform the cartesian coordinates
%into spherical coordinates.
ra = sqrt(x^2+y^2+z^2);
%define the radius.
in = acos(z/ra);
%define the inclination angle.
a = atan(y/z);
%define the azimuth angle.
end
%The function file should be placed in the same folder.
Explanation of Solution
Consider the Cartesian coordinates are,
The spherical coordinates are
The formulas to convert the Cartesian coordinates to spherical coordinates are as follows.
Substitute 1 for
The inclination angle is,
The azimuth angle is,
The spherical coordinates are
MATLAB Code:
% MATLAB code to print the result in spherical coordinates.
%script file.
[x, y, z] = getcartesian();
%get the value of cartesian coordinates by calling the function
%getcartesian.
printspherical(x, y, z)
%print the value in spherical coordinates by calling the function
%printspherical.
% end of script
%The script file should be placed in the same folder.
% MATLAB code to get the result in cartesian coordinates.
%Function file.
function [x, y, z] = getcartesian()
%get the cartesian coordinates by using the function getcartesian.
x = 1;
%define the variable x.
y = 2;
%define the variable y.
z = 3;
%define the variable z.
end
% end of function
%The function file should be placed in the same folder.
% MATLAB code to print the result in spherical coordinates.
%Function file.
function printspherical(x, y, z)
%the spherical coordinates will be printed by using the function
%printspherical.
[rad, incl, azi] = convert2spher(x, y, z);
%convert the spherical coordinates to cartesian coordionates.
fprintf('the radius is %.2f\n', rad);
%print the radius.
fprintf('the inclination angle is %.2f\n', incl);
%print the inclination angle.
fprintf('the azimuth angle is %.4f\n', azi);
%print the azimuth.
end
% end of function
function [ra, in, a] = convert2spher(x, y, z)
%call a subfunction convert2spher to transform the cartesian coordinates
%into spherical coordinates.
ra = sqrt(x^2+y^2+z^2);
%define the radius.
in = acos(z/ra);
%define the inclination angle.
a = atan(y/z);
%define the azimuth angle.
end
%The function file should be placed in the same folder.
Save the MATLAB script with name, paracscript.m and function files with names printspherical.m and getcartesian.m in the current folder. Execute the program by typing the script name at the command window to generate result.
Result:
The result is,
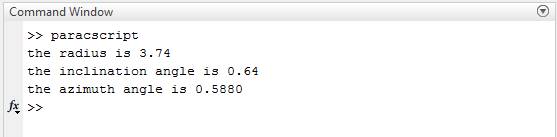
Therefore, the result is stated above.
Want to see more full solutions like this?
Chapter 6 Solutions
Matlab, Fourth Edition: A Practical Introduction to Programming and Problem Solving


- Should you be confident in applying your regression equation to estimate the heart rate of a python at 35°C? Why or why not?arrow_forwardGiven your fitted regression line, what would be the residual for snake #5 (10 C)?arrow_forwardCalculate the 95% confidence interval around your estimate of r using Fisher’s z-transformation. In your final answer, make sure to back-transform to the original units.arrow_forward
- BUSINESS DISCUSSarrow_forwardA researcher wishes to estimate, with 90% confidence, the population proportion of adults who support labeling legislation for genetically modified organisms (GMOs). Her estimate must be accurate within 4% of the true proportion. (a) No preliminary estimate is available. Find the minimum sample size needed. (b) Find the minimum sample size needed, using a prior study that found that 65% of the respondents said they support labeling legislation for GMOs. (c) Compare the results from parts (a) and (b). ... (a) What is the minimum sample size needed assuming that no prior information is available? n = (Round up to the nearest whole number as needed.)arrow_forwardThe table available below shows the costs per mile (in cents) for a sample of automobiles. At a = 0.05, can you conclude that at least one mean cost per mile is different from the others? Click on the icon to view the data table. Let Hss, HMS, HLS, Hsuv and Hмy represent the mean costs per mile for small sedans, medium sedans, large sedans, SUV 4WDs, and minivans respectively. What are the hypotheses for this test? OA. Ho: Not all the means are equal. Ha Hss HMS HLS HSUV HMV B. Ho Hss HMS HLS HSUV = μMV Ha: Hss *HMS *HLS*HSUV * HMV C. Ho Hss HMS HLS HSUV =μMV = = H: Not all the means are equal. D. Ho Hss HMS HLS HSUV HMV Ha Hss HMS HLS =HSUV = HMVarrow_forward
 Trigonometry (MindTap Course List)TrigonometryISBN:9781337278461Author:Ron LarsonPublisher:Cengage Learning
 Algebra & Trigonometry with Analytic GeometryAlgebraISBN:9781133382119Author:SwokowskiPublisher:Cengage
 Algebra and Trigonometry (MindTap Course List)AlgebraISBN:9781305071742Author:James Stewart, Lothar Redlin, Saleem WatsonPublisher:Cengage Learning
 Mathematics For Machine TechnologyAdvanced MathISBN:9781337798310Author:Peterson, John.Publisher:Cengage Learning,
 Trigonometry (MindTap Course List)TrigonometryISBN:9781305652224Author:Charles P. McKeague, Mark D. TurnerPublisher:Cengage Learning