Concept explainers
Videos
Three recessive traits in garden pea plants are as follows: yellow pods are recessive to green pods, bluish green seedlings are recessive to green seedlings, creeper (a plant that cannot stand up) is recessive to normal. A true-breeding normal plant with green pods and green seedlings was crossed to a creeper with yellow pods and bluish green seedlings. The
2059 green pods, green seedlings, normal
151 green pods, green seedlings, creeper
281 green pods, bluish green seedlings, normal
15 green pods, bluish green seedlings, creeper
2041 yellow pods, bluish green seedlings, creeper
157 yellow pods, bluish green seedlings, normal
282 yellow pods, green seedlings, creeper
11 yellow pods, green seedlings, normal
Construct a genetic map that indicates the map distances between these three genes.
To review:
A genetic map indicating map distances between the genes for pod color, seedling color, and plant stature.
Introduction:
Thepair of alleles ofa gene determines the protein encoded by the genes, and results in the phenotype of the trait. True breeders have the monomorphic condition for the alleles of a trait. A genetic map helps in describing the arrangement of the genes on a particular chromosome.
Explanation of Solution
A normal pea plant, which is truebreeding for green seedling and green pods is crossed with a creeper pea plant, having bluish-green seedlings and yellow pods. The F1 offspring are then crossed with a creeper having bluish-green seedlings and yellow pods.
Different characters of the pea plant can be denoted as follows:
Dominant characters: G for green pods, S for green seedling, and C for normal plants
Recessive characters: g for yellow pods, s for bluish green seedlings, and c for the creeper.
Given, the true breeding normal plant, having green seedlings as well as green pods is crossed with true breeding creeper, having bluish green seedling and yellow pods. The genotype of true breeding plants is GGSSCC and ggsscc. Thus, the gametes will be GSC and gsc. The plants in the F1 generation obtained by crossing these true breeders will be GgSsCc.
When three genes are linked then G, S, and C alleles will be linked together whereas g, s, and c alleles will be linked together, on a homologous chromosome. Given, the F1 plants GgSsCc are crossed with ggsscc (creepers having yellow pods and bluish green seedlings) and following results were obtained:
| Number of plants | Phenotype |
| 2059 | Green pods, green seedlings, normal |
| 151 | Green pods, green seedlings, creepers |
| 281 | Green pods, bluish green seedlings, normal |
| 15 | Green pods, bluish green seedlings, creepers |
| 2041 | Yellow pods, bluish green seedlings, creepers |
| 157 | Yellow pods, bluish green seedlings, normal |
| 282 | Yellow pods, green seedlings, creepers |
| 11 | Yellow pods, green seedlings, normal |
The genetic map for the three genes can be constructed by using the below-mentioned formula for map distance:
The distance between the three genes can be measured by separating the data of the offspring and phenotypic categories into gene pair, and then calculating the map distance between the two genes.
For the map distance between the genes for plant stature and pod color,
the number of offsprings is calculated for each pair of plant stature and color of pods.
Non-recombinant offspring are 2340 normal, green pods, and 2323 creeper, yellow pods.
Recombinant offspring are 166 creeper, green pods, and 168 normal, yellow pods.
Therefore, the map distance will be calculated as,
For the map distance between the genes for plant stature and seedling color, the number of offspring having genes for plant stature and color of the seedlingis given as follows:
Nonrecombinant offspring are 2070 normal, green seedlings, and 2056 creeper, bluish green seedlings, and the recombinant offspring are 433 creeper, green seedlings, and 438 normal, bluish green seedlings.
Therefore, the map distance will be calculated as.
For the map distance between the genes for seedling color and pod color, the number of offspring having genes for the color of seedling and pods is given as follows:
Non-recombinant offspring are 2210 green seedling, green pods, and 2198 bluish green seedling, yellow pods, and the recombinant offspring are 296 bluish green seedling, green pods, and 293 green seedling, yellow pods.Therefore, the map distance will be calculated as,
Thus, the distance between the genes for seedling and pods colors is 11.8 mu, and that between the genes for plant stature and seedling color is 17.4 mu and for the genes for plant stature and pod color, it is 6.7 mu. Therefore, the order of the three genes, according to the map distance in-between them will be seedling color, pod color, plant stature. Gene for pod color is present in the middle. Genetic map is shown below:
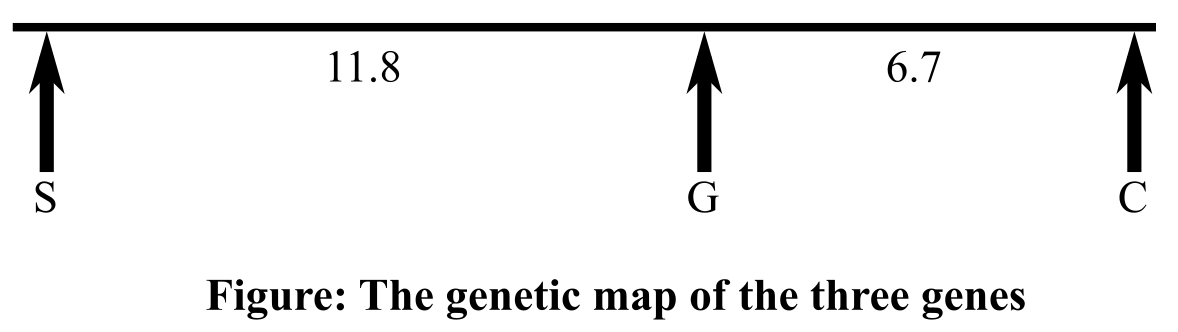
Therefore, it can be concluded that according to the map distance calculated in-between the genes for pod color, plant stature, and seedling color, the order of the three genes will be seedling color, pod color, plant stature(or the opposite order). The distance between the genes responsible for seedling and pods colors is 11.8 mu, and between the genes for plant stature and pod color, it is 6.7 mu. The genes that code for plant stature and seedling color are 17.4 mu apart.
Want to see more full solutions like this?
Chapter 6 Solutions
Genetics: Analysis and Principles


- Molecular Biology Please help with question. thank you You are studying the expression of the lac operon. You have isolated mutants as described below. In the presence of glucose, explain/describe what would happen, for each mutant, to the expression of the lac operon when you add lactose AND what would happen when the bacteria has used up all of the lactose (if the mutant is able to use lactose).5. Mutations in the lac operator that strengthen the binding of the lac repressor 200 fold 6. Mutations in the promoter that prevent binding of RNA polymerase 7. Mutations in CRP/CAP protein that prevent binding of cAMP8. Mutations in sigma factor that prevent binding of sigma to core RNA polymerasearrow_forwardMolecular Biology Please help and there is an attached image. Thank you. A bacteria has a gene whose protein/enzyme product is involved with the synthesis of a lipid necessary for the synthesis of the cell membrane. Expression of this gene requires the binding of a protein (called ACT) to a control sequence (called INC) next to the promoter. A. Is the expression/regulation of this gene an example of induction or repression?Please explain:B. Is this expression/regulation an example of positive or negative control?C. When the lipid is supplied in the media, the expression of the enzyme is turned off.Describe one likely mechanism for how this “turn off” is accomplished.arrow_forwardMolecular Biology Please help. Thank you. Discuss/define the following:(a) poly A polymerase (b) trans-splicing (c) operonarrow_forward
- Molecular Biology Please help with question. Thank you in advance. Discuss, compare and contrast the structure of promoters inprokaryotes and eukaryotes.arrow_forwardMolecular Biology Please help with question. Thank you You are studying the expression of the lac operon. You have isolated mutants as described below. In the absence of glucose, explain/describe what would happen, for each mutant, to the expression of the lac operon when you add lactose AND what would happen when the bacteria has used up all of the lactose (if the mutant is able to use lactose).1. Mutations in the lac repressor gene that would prevent the binding of lactose2. Mutations in the lac repressor gene that would prevent release of lactose once lactose hadbound3. Normally the lac repressor gene is located next to (a few hundred base pairs) and upstreamfrom the lac operon. Mutations in the lac repressor gene that move the lac repressor gene 100,000base pairs downstream.4. Mutations in the lac operator that would prevent binding of lac repressorarrow_forwardYou have returned to college to become a phylogeneticist. One of the first things you wish to do is determine how mammals, birds, and reptiles are related. Like any good scientist, you need to consider all available data objectively and without a preconceived “correct” answer. In pursuit of that, you should produce a phylogenetic tree based only on morphological features that show birds and mammals are more closely related. You will then produce a totally different tree, also using morphological features, that shows birds and reptiles are more closely related. Do not forget to include all three groups in both your trees. Based solely off the trees you produce, which relationship would you consider the more likely and why? Once you have answered that question, provide a brief summary of the “modern” understanding of the relationship between these three groups.arrow_forward
- true or false, the reason geckos can walk on walls is hydrogen bonding between their foot pads and the moisture on the wall.arrow_forwardBiology laboratory problem Please help. thank you You have 20 ul of DNA solution and 6X DNA loading buffer solution. You have to mix your DNA solution and DNA loading buffer before load DNA in an agarose gel. The concentration of the DNA loading buffer must be 1X in the DNA and DNA-loading buffer mixture after you mix them. For that, I will add _____ ul of 6X loading buffer to the 20 ul DNA solution.arrow_forwardBiology lab problem To make 20 ul of 5 mM MgCl2 solution using 50 mM MgCl2 stock solution and distilled water, I will mix ________ ul of 50 mM MgCl2 solution and ________ ul of distilled water. Please help . Thank youarrow_forward
- Biology Please help. Thank you. Biology laboratory question You need 50 ml of 1% (w/v) agarose gel. Agarose is a powder. How would you make it? You can ignore the volume of agarose powder. Don't forget the unit.TBE buffer is used to make an agarose gel, not distilled water. I will add _______ of agarose powder into 50 ml of distilled water (final 50 ml).arrow_forwardAn urgent care center experienced the average patient admissions shown in the Table below during the weeks from the first week of December through the second week of April. Week Average Daily Admissions 1-Dec 11 2-Dec 14 3-Dec 17 4-Dec 15 1-Jan 12 2-Jan 11 3-Jan 9 4-Jan 9 1-Feb 12 2-Feb 8 3-Feb 13 4-Feb 11 1-Mar 15 2-Mar 17 3-Mar 14 4-Mar 19 5-Mar 13 1-Apr 17 2-Apr 13 Forecast admissions for the periods from the first week of December through the second week of April. Compare the forecast admissions to the actual admissions; What do you conclude?arrow_forwardAnalyze the effectiveness of the a drug treatment program based on the needs of 18-65 year olds who are in need of treatment by critically describing 4 things in the program is doing effectively and 4 things the program needs some improvement.arrow_forward
 Concepts of BiologyBiologyISBN:9781938168116Author:Samantha Fowler, Rebecca Roush, James WisePublisher:OpenStax College
 Human Heredity: Principles and Issues (MindTap Co...BiologyISBN:9781305251052Author:Michael CummingsPublisher:Cengage Learning
 Human Biology (MindTap Course List)BiologyISBN:9781305112100Author:Cecie Starr, Beverly McMillanPublisher:Cengage Learning
 Biology: The Dynamic Science (MindTap Course List)BiologyISBN:9781305389892Author:Peter J. Russell, Paul E. Hertz, Beverly McMillanPublisher:Cengage Learning
 Biology (MindTap Course List)BiologyISBN:9781337392938Author:Eldra Solomon, Charles Martin, Diana W. Martin, Linda R. BergPublisher:Cengage Learning
 Biology 2eBiologyISBN:9781947172517Author:Matthew Douglas, Jung Choi, Mary Ann ClarkPublisher:OpenStax