Videos

To complete this problem you must have a computer that is capable of viewing Scalable Vector Graphics (SVG) files. Your Web browser may already be able to view these files. To test to see if your browser can display SVG files, type in the rectline.svg file below and see if you can open it in your Web browser. If your Web browser cannot view the file, then you can search on the Web and download a free SVG viewer.
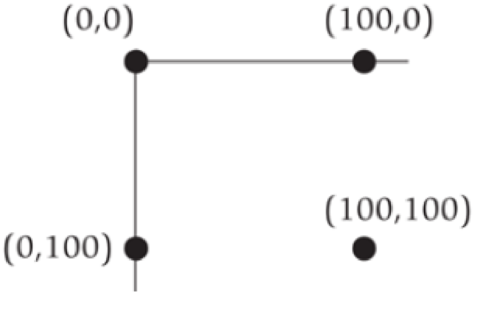
The graphics screen to draw an image uses a coordinate system in which (0, 0) is located in the upper-left corner. The x coordinate increases to the right, and the y coordinate increases to the bottom. Consequently, coordinate (100, 0) would be located 100 pixels directly toward the right from the upper-left corner, and coordinate (0, 100) would be located 100 pixels directly toward the bottom from the upper-left corner. This is illustrated in the figure below.
The SVG format defines a graphics image using XML. The specification for the image is stored in a text file and can be displayed by an SVG viewer. Here is a sample SVG file that draws two rectangles and a line. To view it, save it to a text file with the “.svg” extension, such as rectline.svg, and open it with your SVG viewer.
| <?xml version="1.0" standalone="no"?> <!DOCTYPE svg PUBLIC "-//W3C//DTD SVG 1.1//EN" "http://www.w3.org/Graphics/SVG/1.1/DTD/svg11.dtd"> <svg width="500" height="500" xmlns="http://www.w3.org/2000/svg"> <rect x="20" y="20" width="50" height="250" style="fill:blue;"/> <rect x="75" y="100" width="150" height="50" style="fill:rgb(0,255,0);"/> <line x1="0" y1="0" x2="300" y2="300" style="stroke:purple;stroke-width:2"/> </svg> |
For purposes of this problem, you can ignore the first five lines and the last line and consider them “boilerplate” that must be inserted to properly create the image.
The lines that begins with <rect x="20"…draw a blue rectangle whose upper-left corner is at coordinate (20, 20) and whose width is 50 pixels and height is 250 pixels.
The lines that begin with <rect x="75"…draw a green rectangle (RGB color value of 0,255,0 is all green) whose upper-left corner is at coordinate (75, 100) and whose width is 150 pixels and height is 50 pixels.
Finally, the <line> tag draws a purple line from (0, 0) to (300, 300) with a width of 2.
Based on this example, write a

Want to see the full answer?
Check out a sample textbook solution
Chapter 6 Solutions
Problem Solving with C++ (10th Edition)
Additional Engineering Textbook Solutions
Starting Out with C++: Early Objects (9th Edition)
Degarmo's Materials And Processes In Manufacturing
SURVEY OF OPERATING SYSTEMS
Starting Out with Python (4th Edition)
Java: An Introduction to Problem Solving and Programming (8th Edition)
Electric Circuits. (11th Edition)


- Obtain the MUX design for the function F(X,Y,Z) = (0,3,4,7) using an off-the-shelf MUX with an active low strobe input (E).arrow_forwardI cannot program smart home automation rules from my device using a computer or phone, and I would like to know how to properly connect devices such as switches and sensors together ? Cisco Packet Tracer 1. Smart Home Automation:o Connect a temperature sensor and a fan to a home gateway.o Configure the home gateway so that the fan is activated when the temperature exceedsa set threshold (e.g., 30°C).2. WiFi Network Configuration:o Set up a wireless LAN with a unique SSID.o Enable WPA2 encryption to secure the WiFi network.o Implement MAC address filtering to allow only specific clients to connect.3. WLC Configuration:o Deploy at least two wireless access points connected to a Wireless LAN Controller(WLC).o Configure the WLC to manage the APs, broadcast the configured SSID, and applyconsistent security settings across all APs.arrow_forwardusing r language for integration theta = integral 0 to infinity (x^4)*e^(-x^2)/2 dx (1) use the density function of standard normal distribution N(0,1) f(x) = 1/sqrt(2pi) * e^(-x^2)/2 -infinity <x<infinity as importance function and obtain an estimate theta 1 for theta set m=100 for the estimate whatt is the estimate theta 1? (2)use the density function of gamma (r=5 λ=1/2)distribution f(x)=λ^r/Γ(r) x^(r-1)e^(-λx) x>=0 as importance function and obtain an estimate theta 2 for theta set m=1000 fir the estimate what is the estimate theta2? (3) use simulation (repeat 1000 times) to estimate the variance of the estimates theta1 and theta 2 which one has smaller variance?arrow_forward
- using r language A continuous random variable X has density function f(x)=1/56(3x^2+4x^3+5x^4).0<=x<=2 (1) secify the density g of the random variable Y you find for the acceptance rejection method. (2) what is the value of c you choose to use for the acceptance rejection method (3) use the acceptance rejection method to generate a random sample of size 1000 from the distribution of X .graph the density histogram of the sample and compare it with the density function f(x)arrow_forwardusing r language a continuous random variable X has density function f(x)=1/4x^3e^-(pi/2)^4,x>=0 derive the probability inverse transformation F^(-1)x where F(x) is the cdf of the random variable Xarrow_forwardusing r language in an accelerated failure test, components are operated under extreme conditions so that a substantial number will fail in a rather short time. in such a test involving two types of microships 600 chips manufactured by an existing process were tested and 125 of them failed then 800 chips manufactured by a new process were tested and 130 of them failed what is the 90%confidence interval for the difference between the proportions of failure for chips manufactured by two processes? using r languagearrow_forward
- I want a picture of the tools and the pictures used Cisco Packet Tracer Smart Home Automation:o Connect a temperature sensor and a fan to a home gateway.o Configure the home gateway so that the fan is activated when the temperature exceedsa set threshold (e.g., 30°C).2. WiFi Network Configuration:o Set up a wireless LAN with a unique SSID.o Enable WPA2 encryption to secure the WiFi network.o Implement MAC address filtering to allow only specific clients to connect.3. WLC Configuration:o Deploy at least two wireless access points connected to a Wireless LAN Controller(WLC).o Configure the WLC to manage the APs, broadcast the configured SSID, and applyconsistent security settings across all APs.arrow_forwardA. What will be printed executing the code above?B. What is the simplest way to set a variable of the class Full_Date to January 26 2020?C. Are there any empty constructors in this class Full_Date?a. If there is(are) in which code line(s)?b. If there is not, how would an empty constructor be? (create the code lines for it)D. Can the command std::cout << d1.m << std::endl; be included after line 28 withoutcausing an error?a. If it can, what will be printed?b. If it cannot, how could this command be fixed?arrow_forwardCisco Packet Tracer Smart Home Automation:o Connect a temperature sensor and a fan to a home gateway.o Configure the home gateway so that the fan is activated when the temperature exceedsa set threshold (e.g., 30°C).2. WiFi Network Configuration:o Set up a wireless LAN with a unique SSID.o Enable WPA2 encryption to secure the WiFi network.o Implement MAC address filtering to allow only specific clients to connect.3. WLC Configuration:o Deploy at least two wireless access points connected to a Wireless LAN Controller(WLC).o Configure the WLC to manage the APs, broadcast the configured SSID, and applyconsistent security settings across all APs.arrow_forward
- Transform the TM below that accepts words over the alphabet Σ= {a, b} with an even number of a's and b's in order that the output tape head is positioned over the first letter of the input, if the word is accepted, and all letters a should be replaced by the letter x. For example, for the input aabbaa the tape and head at the end should be: [x]xbbxx z/z,R b/b,R F ① a/a,R b/b,R a/a, R a/a,R b/b.R K a/a,R L b/b,Rarrow_forwardGiven the C++ code below, create a TM that performs the same operation, i.e., given an input over the alphabet Σ= {a, b} it prints the number of letters b in binary. 1 #include 2 #include 3 4- int main() { std::cout > str; for (char c : str) { if (c == 'b') count++; 5 std::string str; 6 int count = 0; 7 char buffer [1000]; 8 9 10 11- 12 13 14 } 15 16- 17 18 19 } 20 21 22} std::string binary while (count > 0) { binary = std::to_string(count % 2) + binary; count /= 2; std::cout << binary << std::endl; return 0;arrow_forwardConsidering the CFG described below, answer the following questions. Σ = {a, b} • NT = {S} Productions: P1 S⇒aSa P2 P3 SbSb S⇒ a P4 S⇒ b A. List one sequence of productions that can accept the word abaaaba; B. Give three 5-letter words that can be accepted by this CFG; C. Create a Pushdown automaton capable of accepting the language accepted by this CFG.arrow_forward
 Microsoft Visual C#Computer ScienceISBN:9781337102100Author:Joyce, Farrell.Publisher:Cengage Learning,
 New Perspectives on HTML5, CSS3, and JavaScriptComputer ScienceISBN:9781305503922Author:Patrick M. CareyPublisher:Cengage Learning
 Programming Logic & Design ComprehensiveComputer ScienceISBN:9781337669405Author:FARRELLPublisher:Cengage
 EBK JAVA PROGRAMMINGComputer ScienceISBN:9781337671385Author:FARRELLPublisher:CENGAGE LEARNING - CONSIGNMENTNp Ms Office 365/Excel 2016 I NtermedComputer ScienceISBN:9781337508841Author:CareyPublisher:Cengage