
Concept explainers
Videos
Federal Aid and Representation. For each of 31 states, the
a. If you live in a state with 500,000 people per Senator, are you rnore or less well represented in the Senate than if you live in a state with 2,000,000 people per Senator?
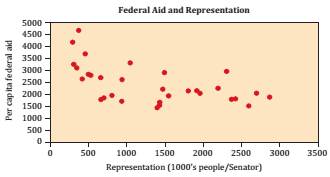
b. ln light of part (a), does representation increase or decrease in moving to the right on the graph?
c. Describe the overall trend in the data. In general, does federal aid increase or decrease with representation?
d. Describe the
e. Do you believe the correlation between representation and federal aid is more likely a coincidence, due to a common underlying cause, or due to a causal relationship? Explain.
Want to see the full answer?
Check out a sample textbook solution
Chapter 5 Solutions
EP USING+UNDERSTANDING MATH.-MYMATHLAB


- Please Help me answer this linear algebra question. This is a practice textbook question.arrow_forward1. a scientist observed a bacterium in a microscope. it measured about .0000029 meter in diameter which of the following is closest to it? A- 2 x 10^-6, B- 2 x 10^-5, C- 3 x 10^-5, or D- 3 x 10^-6 2.express the product of 500 and 400 in scientific notation. is it 2 x 10^5 or 2 x 10^4 or 2 x 10^3 or 20 x 10^4arrow_forwardExample 4 (Part 1) One of the datasets in the Lock book contains information about 215 countries of the world. One of the variables is the percentage of people in the country who have access to the internet. We have data for 203 of those countries. The plot on the right shows a dotplot of the data. 1. What are the cases? Population n = 203, mean = 43.024 median = 43.5, stdev = 29.259 20 2. What does each dot on the dotplot represent? 15 10 5 20 40 43.024 60 80 3. What type of data is do we collect from the cases, quantitative or categorical?arrow_forward
- No chatgpt pls will upvotearrow_forwardi dont know the anserarrow_forwardLet x be a random variable that represents the percentage of successful free throws a professional basketball player makes in a season. Let y be a random variable that represents the percentage of successful field goals a professional basketball player makes in a season. A random sample of n =6 professional basketball players gave the following information. x 63 79 70 80 84 87 y 46 49 45 55 57 58 Find Se. Round your answer to three decimal places.arrow_forward
 Algebra: Structure And Method, Book 1AlgebraISBN:9780395977224Author:Richard G. Brown, Mary P. Dolciani, Robert H. Sorgenfrey, William L. ColePublisher:McDougal Littell
 Glencoe Algebra 1, Student Edition, 9780079039897...AlgebraISBN:9780079039897Author:CarterPublisher:McGraw Hill
 Holt Mcdougal Larson Pre-algebra: Student Edition...AlgebraISBN:9780547587776Author:HOLT MCDOUGALPublisher:HOLT MCDOUGAL
 Trigonometry (MindTap Course List)TrigonometryISBN:9781337278461Author:Ron LarsonPublisher:Cengage Learning
 College AlgebraAlgebraISBN:9781305115545Author:James Stewart, Lothar Redlin, Saleem WatsonPublisher:Cengage Learning