USING+UNDERSTANDING MATH.(LL)-W/MYMATH.
7th Edition
ISBN: 9780135237236
Author: Bennett
Publisher: PEARSON
expand_more
expand_more
format_list_bulleted
Videos
Textbook Question
Chapter 5.D, Problem 35E
Refugees to Europe. Figure 5.31 shows the numbers of refugees arriving in Europe from three countries of origin in
2016.
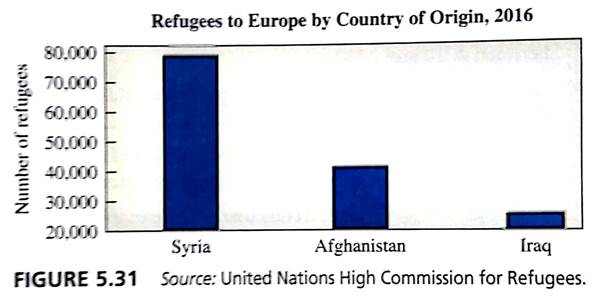
a. What is the ratio of refugees from Iraq to refugees from Syria? What is the ratio of the lengths of the corresponding bars in the graph?
b. Based on your answer to part (a), do you consider the graph to be deceptive? Explain.
c. Redraw the bar graph with a starting point of zero on the vertical axis.
Expert Solution & Answer
Want to see the full answer?
Check out a sample textbook solution
Students have asked these similar questions
Let m(t) be a continuous function with a domain of all real numbers. The table below shows some of the values of m(t) .
Assume the characteristics of this function are represented in the table.
t
-3 -2 8 11
12
m(t) -7 6
3
-9
0
(a) The point (-3, -7) is on the graph of m(t). Find the corresponding point on the graph of the transformation y = -m(t) + 17.
(b) The point (8, 3) is on the graph of m(t). Find the corresponding point on the graph of the transformation y =
-m (−t) .
24
(c) Find f(12), if we know that f(t) = |m (t − 1)|
f(12) =
For unemployed persons in the United States, the average number of months of unemployment at the end of December 2009 was approximately seven months (Bureau of Labor Statistics, January 2010). Suppose the following data are for a particular region in upstate New York. The values in the first column show the number of
months unemployed and the values in the second column show the corresponding number of unemployed persons.
Months
Unemployed
Number
Unemployed
1
1029
2
1686
3
2269
4
2675
5
3487
6
4652
7
4145
8
3587
9
2325
10
1120
Let x be a random variable indicating the number of months a person is unemployed.
a. Use the data to develop an empirical discrete probability distribution for x (to 4 decimals).
(x)
f(x)
1
2
3
4
5
6
7
8
9
10
b. Show that your probability distribution satisfies the conditions for a valid discrete probability distribution.
The input in the box below will not be graded, but may be reviewed and considered by your instructor.
blank
c. What is the probability that a…
West Virginia has one of the highest divorce rates in the nation, with an annual rate of approximately 5 divorces per 1000 people (Centers for Disease Control and Prevention website, January 12, 2012). The Marital Counseling Center, Inc. (MCC) thinks that the high divorce rate in the state may require them to hire additional staff.
Working with a consultant, the management of MCC has developed the following probability distribution for x = the number of new clients for marriage counseling for the next year.
Excel File: data05-19.xls
x
10
f(x)
.05
20
30
.10
.10
40
.20
50
60
.35
.20
a. Is this probability distribution valid?
- Select your answer-
Explain.
f(x)
Σf(x)
Select your answer
Select your answer
b. What is the probability MCC will obtain more than 30 new clients (to 2 decimals)?
c. What is the probability MCC will obtain fewer than 20 new clients (to 2 decimals)?
d. Compute the expected value and variance of x.
Expected value
Variance
clients per year
squared clients per year
Chapter 5 Solutions
USING+UNDERSTANDING MATH.(LL)-W/MYMATH.
Ch. 5.A - You conduct a poll in which you randomly select...Ch. 5.A - Results of the poll described in question 1 would...Ch. 5.A - When we say that a sample is representative of the...Ch. 5.A - A poll concerning support for mass transit is...Ch. 5.A - Consider an experiment designed to test whether...Ch. 5.A - The experiment described in question 4 is a....Ch. 5.A - The purpose of a placebo is a. to prevent...Ch. 5.A - An experiment is single-blind if a. it lacks a...Ch. 5.A - Poll X predicts that Powell will receive 49% of...Ch. 5.A - A survey reveals that 12% of Americans believe...
Ch. 5.A - 1. Why do we say that the term statistics has two...Ch. 5.A - 2. Define the terms populatíon, sample, population...Ch. 5.A - Describe the five basic steps in a statistical...Ch. 5.A - Why is a so important that a statistical study use...Ch. 5.A - Prob. 5ECh. 5.A - Prob. 6ECh. 5.A - What is a placebo? Describe the placebo effect and...Ch. 5.A - What is meant by the margin of error in a survey...Ch. 5.A - In my experimental study, I used a sample that was...Ch. 5.A - I followed all the guidelines for sample selection...Ch. 5.A - I wanted to test the effects of vitamin C on...Ch. 5.A - I don’t believe the results of the experiment...Ch. 5.A - A pollster plans to improve survey results by...Ch. 5.A - By choosing my sample carefully, I can make a good...Ch. 5.A - Population and Sample. For the following studies,...Ch. 5.A - 15–20: Population and Sample. For the following...Ch. 5.A - 15–20: Population and Sample. For the following...Ch. 5.A - In a test of the effectiveness of garlic for...Ch. 5.A - In an Accountemps survey of 150 senior executives,...Ch. 5.A - Population and Sample. For the following studies,...Ch. 5.A - Prob. 21ECh. 5.A - Prob. 22ECh. 5.A - Prob. 23ECh. 5.A - Steps in a Study. Describe how you would apply the...Ch. 5.A - 21-26: Steps in a Study. Describe how you would...Ch. 5.A - Prob. 26ECh. 5.A - Representative Sample? You want to determine the...Ch. 5.A - Representative Sample? You want to determine the...Ch. 5.A - Identify the Sampling Method. Identify the...Ch. 5.A - Identify the Sampling Method. Identify the...Ch. 5.A - Identify the Sampling Method. Identify the...Ch. 5.A - Identify the Sampling Method. Identify the...Ch. 5.A - Identify the Sampling Method. Identify the...Ch. 5.A - Identify the Sampling Method. Identify the...Ch. 5.A - Type of Study. Determine whether the following...Ch. 5.A - Type of Study. Determine whether the following...Ch. 5.A - Type of Study. Determine whether each of the...Ch. 5.A - Type of Study. Determine whether the following...Ch. 5.A - Prob. 39ECh. 5.A - Prob. 40ECh. 5.A - Prob. 41ECh. 5.A - Prob. 42ECh. 5.A - Prob. 43ECh. 5.A - Prob. 44ECh. 5.A - Prob. 45ECh. 5.A - Prob. 46ECh. 5.A - Margin of Error. The following summaries of...Ch. 5.A - A Gallup poll found that 36% of Americans favor a...Ch. 5.A - Margin of Error. The following summaries of...Ch. 5.A - Margin of Error. The following summaries of...Ch. 5.A - Effectiveness of a New Drug. As part of the U.S....Ch. 5.A - Real Studies. Consider the following statistical...Ch. 5.A - Real Studies. Consider the following statistical...Ch. 5.A - Prob. 54ECh. 5.A - 55. A Fox News poll carried out by phone...Ch. 5.A - Prob. 56ECh. 5.A - Prob. 57ECh. 5.A - Prob. 58ECh. 5.A - Statistics in the News. Select three news stories...Ch. 5.A - 62. Statistics in Your Major. Write two to three...Ch. 5.A - Prob. 61ECh. 5.A - Prob. 62ECh. 5.A - 65. Poor Sampling. Find a new article about a...Ch. 5.A - 66. Good Sampling. Find a recent news article that...Ch. 5.A - 67. Margin of Error. Find a report of a recent...Ch. 5.A - Prob. 66ECh. 5.A - Prob. 67ECh. 5.B - You read about an issue that was the subject of an...Ch. 5.B - A study conducted by the oil company Exxon Mobil...Ch. 5.B - Consider a study designed to learn about the...Ch. 5.B - The show The Voice selects winners based on votes...Ch. 5.B - Consider an experiment in which you measure the...Ch. 5.B - Consider a survey in which 1000 people arc asked...Ch. 5.B - Imagine that a survey of randomly selected people...Ch. 5.B - You want to know whether people prefer Smith or...Ch. 5.B - A self-selected survey is one in which a. the...Ch. 5.B - If a statistical study is carefully conducted tn...Ch. 5.B - Prob. 1ECh. 5.B - Prob. 2ECh. 5.B - Prob. 3ECh. 5.B - Prob. 4ECh. 5.B - More than 1 million people sent texts in response...Ch. 5.B - Thc survey of religious beliefs suffered from...Ch. 5.B - My experiment proved beyond a doubt that vitamin C...Ch. 5.B - Everyone who jogs for exercise should try the new...Ch. 5.B - Prob. 9ECh. 5.B - Should You Believe This Study? Based solely on the...Ch. 5.B - 9-20: Should You Believe This Study? Based solely...Ch. 5.B - 9–20: Should You Believe This Study? Based solely...Ch. 5.B - Should You Believe This Study? Based solely on the...Ch. 5.B - Prob. 14ECh. 5.B - Should You Believe This Study? Based solely on the...Ch. 5.B - Should You Believe This Study? Based solely on the...Ch. 5.B - Prob. 17ECh. 5.B - Should You Believe This Study? Based solely on the...Ch. 5.B - Should You Believe This Study? Based solely on the...Ch. 5.B - Prob. 20ECh. 5.B - 21–26: Should You Believe This Claim? Based solely...Ch. 5.B - Prob. 22ECh. 5.B - Prob. 23ECh. 5.B - Prob. 24ECh. 5.B - Prob. 25ECh. 5.B - Should You Believe This Claim? Based solely on the...Ch. 5.B - Prob. 27ECh. 5.B - Prob. 28ECh. 5.B - Bias. Identify at least one potential source of...Ch. 5.B - Prob. 30ECh. 5.B - Bias. Identify at least one potential source of...Ch. 5.B - Prob. 32ECh. 5.B - Prob. 33ECh. 5.B - Prob. 34ECh. 5.B - 35. Its All in the Wording. Princeton Survey...Ch. 5.B - 36. It’s All in the Wording. The Pew Research...Ch. 5.B - Prob. 37ECh. 5.B - Stat-Bytes. Much like sound bytes of news stories,...Ch. 5.B - Prob. 39ECh. 5.B - Prob. 40ECh. 5.B - Prob. 41ECh. 5.B - Prob. 42ECh. 5.B - Accurate Headlines? Consider the following...Ch. 5.B - 43–44: Accurate Headlines? Consider the following...Ch. 5.B - 45. What is the Question? Discuss the differences...Ch. 5.B - 46. Exercise and Dementia. A recent study in the...Ch. 5.B - Prob. 47ECh. 5.B - Prob. 48ECh. 5.B - Prob. 49ECh. 5.B - Prob. 50ECh. 5.B - Prob. 51ECh. 5.C - In a class of 200 students, 50 students received a...Ch. 5.C - For the class described in question 1, what was...Ch. 5.C - Which of the following is an example of...Ch. 5.C - The sizes of the wedges in a pie chart tell you a....Ch. 5.C - You have a table listing ten tourist attractions...Ch. 5.C - In the table of tourist attractions and visitors...Ch. 5.C - You have a list of the GPAs of 100 college...Ch. 5.C - You have a list of the average gasoline price for...Ch. 5.C - A histogram is a. a graph that shows how some...Ch. 5.C - You have a histogram and you want to convert it...Ch. 5.C - Prob. 1ECh. 5.C - Prob. 2ECh. 5.C - Prob. 3ECh. 5.C - Prob. 4ECh. 5.C - Prob. 5ECh. 5.C - 6. What two types of graphs are most common when...Ch. 5.C - I made a frequency table with two columns, one...Ch. 5.C - The relative frequency of B grades in our class...Ch. 5.C - The cumulative frequency of C grades in our class...Ch. 5.C - Your bar graph must be wrong, because you have 10...Ch. 5.C - Your pie chart must be wrong, because when I added...Ch. 5.C - I rearranged the bars on my histogram the tallest...Ch. 5.C - 13-14: Frequency Tables. Make frequency tables for...Ch. 5.C - Prob. 14ECh. 5.C - 15-22: Qualitative versus Quantitative. Determine...Ch. 5.C - Qualitative versus Quantitative. Determine whether...Ch. 5.C - 15-22: Qualitative versus Quantitative. Determine...Ch. 5.C - Qualitative versus Quantitative. Determine whether...Ch. 5.C - Qualitative versus Quantitative. Determine whether...Ch. 5.C - Qualitative versus Quantitative. Determine whether...Ch. 5.C - 15-22: Qualitative versus Quantitative. Determine...Ch. 5.C - Qualitative versus Quantitative. Determine whether...Ch. 5.C - Binned Frequency Tables. Use the given bin sizes...Ch. 5.C - Binned Frequency Tables. Use the given bin sizes...Ch. 5.C - 25. Most Populous Countries. The following table...Ch. 5.C - Prob. 26ECh. 5.C - Prob. 27ECh. 5.C - Prob. 28ECh. 5.C - Prob. 29ECh. 5.C - Prob. 30ECh. 5.C - 31. Cell Phone Subscriptions. The following table...Ch. 5.C - 32. Death Rates. Figure 5.10 is a time-series...Ch. 5.C - U.S. Electrical Energy. The following table gives...Ch. 5.C - Prob. 34ECh. 5.C - Ages of Nobel Prize Winners. The Following...Ch. 5.C - Prob. 36ECh. 5.C - Prob. 37ECh. 5.C - Prob. 38ECh. 5.C - Immigrant Data. The following table gives the...Ch. 5.C - Prob. 40ECh. 5.C - Prob. 41ECh. 5.C - 49. Bar Graph. Find a recent news article tha...Ch. 5.C - 50. Pie Chart. Find a recent news article that...Ch. 5.C - 51. Histogram. Find a recent news article that...Ch. 5.C - 52. Line Chart. Find a recent news article that...Ch. 5.C - Answer the following questions using procedures...Ch. 5.C - 47. U.S. Population in Poverty. Use Excel or with...Ch. 5.C - 48. StatCrunch Data Entry. To gain practice...Ch. 5.C - 49. NFL Data. Open the shared data set called NFL...Ch. 5.C - Prob. 50ECh. 5.D - Based on Figure 5.12, which statement is correct?...Ch. 5.D - Prob. 2QQCh. 5.D - Prob. 3QQCh. 5.D - Prob. 4QQCh. 5.D - Prob. 5QQCh. 5.D - Prob. 6QQCh. 5.D - Which of the following best describes the...Ch. 5.D - Prob. 8QQCh. 5.D - 9. Consider Figure 5.22(a). Moving one tick mark...Ch. 5.D - 10. Consider Figure 5.23(a). In years where the...Ch. 5.D - Briefly describe the construction and use of...Ch. 5.D - What are geographical data? Briefly describe at...Ch. 5.D - What are three-dimensional graphics? Explain the...Ch. 5.D - What are infographics, and what is their goal?Ch. 5.D - Prob. 5ECh. 5.D - 6. What is an exponential scale? When is an...Ch. 5.D - Explain how a graph that shows percentage change...Ch. 5.D - Prob. 8ECh. 5.D - My bar chart contains more information than yours,...Ch. 5.D - 10. I used an exponential scale because the data...Ch. 5.D - Prob. 11ECh. 5.D - A graph showing the yearly rate of increase in the...Ch. 5.D - Educational Value. Use the graphs in Figure 5.11...Ch. 5.D - 13-16: Educational Value. Use the graphs in Figure...Ch. 5.D - Prob. 15ECh. 5.D - Prob. 16ECh. 5.D - Gender and Mathematics. Consider the data...Ch. 5.D - Gender and Science. The following table gives data...Ch. 5.D - Prob. 19ECh. 5.D - Prob. 20ECh. 5.D - Disease Stack Plot. Use Figure 5.14 to answer the...Ch. 5.D - Disease Stack Plot. Use Figure 5.14 to answer the...Ch. 5.D - 23. Figure 5.24 shows a stack plot of federal...Ch. 5.D - 24. College Degrees. Figure 5.25 shows the numbers...Ch. 5.D - 25-26: Melanoma Mortality. Figure 5.26 shows the...Ch. 5.D - Prob. 26ECh. 5.D - Prob. 27ECh. 5.D - Prob. 28ECh. 5.D - Prob. 29ECh. 5.D - Prob. 30ECh. 5.D - Prob. 31ECh. 5.D - Infographic. Use Figure 5.18 to answer the...Ch. 5.D - Volume Distortion. Figure 5.29 depicts the amounts...Ch. 5.D - Three-DimensionaI Pies. The pie charts in Figure...Ch. 5.D - Refugees to Europe. Figure 5.31 shows the numbers...Ch. 5.D - 36. Life Expectancy. Figure 5.32 shows the life...Ch. 5.D - 37. Moore’s Law. Moore law refers to a prediction...Ch. 5.D - Prob. 38ECh. 5.D - Prob. 39ECh. 5.D - Percentage Change in the CPI. Figure 5.33 shows...Ch. 5.D - Prob. 41ECh. 5.D - Prob. 42ECh. 5.D - Prob. 43ECh. 5.D - Prob. 44ECh. 5.D - Prob. 45ECh. 5.D - Prob. 46ECh. 5.D - 47-52: Creating Graphics. Make a graphical display...Ch. 5.D - 47-52: Creating Graphics. Make a graphical display...Ch. 5.D - Creating Graphics. Make a graphical display of the...Ch. 5.D - Prob. 50ECh. 5.D - Prob. 51ECh. 5.D - Prob. 52ECh. 5.D - Prob. 53ECh. 5.D - Prob. 54ECh. 5.D - Prob. 55ECh. 5.D - Prob. 56ECh. 5.D - Prob. 57ECh. 5.D - Prob. 58ECh. 5.D - Prob. 59ECh. 5.D - 46. Interactive Infographics. Find a few examples...Ch. 5.D - Answer the following questions using procedures...Ch. 5.D - Answer the following questions using procedures...Ch. 5.D - Prob. 63ECh. 5.D - Prob. 64ECh. 5.D - Prob. 65ECh. 5.D - Answer the following questions using procedures...Ch. 5.D - Prob. 67ECh. 5.D - Prob. 68ECh. 5.E - If X is correlated with Y, a. X causes Y. b....Ch. 5.E - Figure 5.40. According to this diagram, life...Ch. 5.E - If the points on a scatterplot fall on a nearly...Ch. 5.E - If the points on a scatterplot fall into a broad...Ch. 5.E - When can you rule out the possibility that changes...Ch. 5.E - What type of correlation would you expect between...Ch. 5.E - You have found a higher rate of birth defects...Ch. 5.E - Based on the data in Figure 5.38, abou how much...Ch. 5.E - Which of the following statements best describes...Ch. 5.E - A finding by a jury that a pcrson is guilty...Ch. 5.E - What is a correlation? Give three examples of...Ch. 5.E - What is a scatterplot, and how is one made? How...Ch. 5.E - Prob. 3ECh. 5.E - Describe the three general categories of...Ch. 5.E - 5. Briefly describe each of the six guidelines...Ch. 5.E - Briefly describe three levels of confidence in...Ch. 5.E - There is a strong negative correlation between the...Ch. 5.E - There is a strong positive correlation between the...Ch. 5.E - I found a nearly perfect positive correlation...Ch. 5.E - I found a nearly perfect negative correlation...Ch. 5.E - I had originally suspected that an increase in...Ch. 5.E - Prob. 12ECh. 5.E - Interpreting Scatterplots. Consider the following...Ch. 5.E - Interpreting Scatterplots. Consider the following...Ch. 5.E - Interpreting Scatterplots. Consider the following...Ch. 5.E - Interpreting Scatterplots. Consider the following...Ch. 5.E - Types of Correlation. For the following pairs of...Ch. 5.E - Types of Correlation. For the following pairs of...Ch. 5.E - Types of Correlation. For the following pairs of...Ch. 5.E - Prob. 20ECh. 5.E - Prob. 21ECh. 5.E - Prob. 22ECh. 5.E - 17–24: Types of Correlation. For the following...Ch. 5.E - Prob. 24ECh. 5.E - Prob. 25ECh. 5.E - Making Scatterplots. Consider the following data...Ch. 5.E - Making Scatterplots. Consider the following data...Ch. 5.E - Prob. 28ECh. 5.E - Prob. 29ECh. 5.E - Making Scatterplots. Consider the following data...Ch. 5.E - Federal Aid and Graduation Rates. Figure 5.43...Ch. 5.E - Correlation and Causality. Consider the following...Ch. 5.E - Correlation and Causality. Consider the following...Ch. 5.E - Correlation and Causality. Consider the following...Ch. 5.E - Correlation and Causality. Consider the following...Ch. 5.E - Correlation and Causality. Consider the following...Ch. 5.E - Correlation and Causality. Consider the following...Ch. 5.E - 38. Identifying Causes: Headaches. You are trying...Ch. 5.E - 39. Smoking and Lung Cancer. There is a strong...Ch. 5.E - Prob. 40ECh. 5.E - Prob. 41ECh. 5.E - Prob. 42ECh. 5.E - Prob. 43ECh. 5.E - Prob. 44ECh. 5.E - Prob. 45ECh. 5.E - Prob. 46ECh. 5.E - Prob. 47ECh. 5.E - Answer the following questions using procedures...Ch. 5.E - Exercise and TV Open the shared data set called...Ch. 5.E - 50. StatCrunch Project. Choose one data set...
Knowledge Booster


Learn more about
Need a deep-dive on the concept behind this application? Look no further. Learn more about this topic, subject and related others by exploring similar questions and additional content below.Similar questions
- For unemployed persons in the United States, the average number of months of unemployment at the end of December 2009 was approximately seven months (Bureau of Labor Statistics, January 2010). Suppose the following data are for a particular region in upstate New York. The values in the first column show the number of months unemployed and the values in the second column show the corresponding number of unemployed persons. Months Unemployed Number Unemployed 1 1029 2 1686 3 2269 4 2675 5 3487 6 4652 7 4145 8 3587 9 2325 10 1120 Let x be a random variable indicating the number of months a person is unemployed. a. Use the data to develop an empirical discrete probability distribution for x (to 4 decimals). (x) f(x) 1 2 3 4 5 6 7 8 9 10 b. Show that your probability distribution satisfies the conditions for a valid discrete probability distribution. The input in the box below will not be graded, but may be reviewed and considered by your instructor. c. What is the probability that a person…arrow_forwardIn Gallup's Annual Consumption Habits Poll, telephone interviews were conducted for a random sample of 1014 adults aged 18 and over. One of the questions was "How many cups of coffee, if any, do you drink on an average day?" The following table shows the results obtained (Gallup website, August 6, 2012). Excel File: data05-23.xls Number of Cups per Day Number of Responses 0 365 264 193 3 4 or more 91 101 Define a random variable x = number of cups of coffee consumed on an average day. Let x = 4 represent four or more cups. Round your answers to four decimal places. a. Develop a probability distribution for x. x 0 1 2 3 4 f(x) b. Compute the expected value of x. cups of coffee c. Compute the variance of x. cups of coffee squared d. Suppose we are only interested in adults that drink at least one cup of coffee on an average day. For this group, let y = the number of cups of coffee consumed on an average day. Compute the expected value of y. Compare it to the expected value of x. The…arrow_forwardrounded to two decimal places at each calculationarrow_forward
- In Gallup's Annual Consumption Habits Poll, telephone interviews were conducted for a random sample of 1014 adults aged 18 and over. One of the questions was "How many cups of coffee, if any, do you drink on an average day?" The following table shows the results obtained (Gallup website, August 6, 2012). Excel File: data05-23.xls Number of Cups per Day Number of Responses 0 365 264 193 2 3 4 or more 91 101 Define a random variable x = number of cups of coffee consumed on an average day. Let x = 4 represent four or more cups. Round your answers to four decimal places. a. Develop a probability distribution for x. x 0 1 2 3 f(x) b. Compute the expected value of x. cups of coffee c. Compute the variance of x. cups of coffee squared d. Suppose we are only interested in adults that drink at least one cup of coffee on an average day. For this group, let y = the number of cups of coffee consumed on an average day. Compute the expected value of y. Compare it to the expected value of x. The…arrow_forwardA technician services mailing machines at companies in the Phoenix area. Depending on the type of malfunction, the service call can take 1, 2, 3, or 4 hours. The different types of malfunctions occur at about the same frequency. Develop a probability distribution for the duration of a service call. Duration of Call x f(x) 1 2 3 4 Which of the following probability distribution graphs accurately represents the data set? Consider the required conditions for a discrete probability function, shown below.Does this probability distribution satisfy equation (5.1)?Does this probability distribution satisfy equation (5.2)? What is the probability a service call will take three hours? A service call has just come in, but the type of malfunction is unknown. It is 3:00 P.M. and service technicians usually get off at 5:00 P.M. What is the probability the service technician will have to work overtime to fix the machine today?arrow_forwardA psychologist determined that the number of sessions required to obtain the trust of a new patient is either 1, 2, or 3. Let x be a random variable indicating the number of sessions required to gain the patient's trust. The following probability function has been proposed. x f(x) for x = 1, 2, or 3 a. Consider the required conditions for a discrete probability function, shown below. f(x) ≥0 Σf(x) = 1 (5.1) (5.2) Does this probability distribution satisfy equation (5.1)? Select Does this probability distribution satisfy equation (5.2)? Select b. What is the probability that it takes exactly 2 sessions to gain the patient's trust (to 3 decimals)? c. What is the probability that it takes at least 2 sessions to gain the patient's trust (to 3 decimals)?arrow_forward
- A technician services mailing machines at companies in the Phoenix area. Depending on the type of malfunction, the service call can take 1, 2, 3, or 4 hours. The different types of malfunctions occur at about the same frequency. Develop a probability distribution for the duration of a service call. Which of the following probability distribution graphs accurately represents the data set? Consider the required conditions for a discrete probability function, shown below.Does this probability distribution satisfy equation (5.1)?Does this probability distribution satisfy equation (5.2)? What is the probability a service call will take three hours? A service call has just come in, but the type of malfunction is unknown. It is 3:00 P.M. and service technicians usually get off at 5:00 P.M. What is the probability the service technician will have to work overtime to fix the machine today?arrow_forwardWest Virginia has one of the highest divorce rates in the nation, with an annual rate of approximately 5 divorces per 1000 people (Centers for Disease Control and Prevention website, January 12, 2012). The Marital Counseling Center, Inc. (MCC) thinks that the high divorce rate in the state may require them to hire additional staff. Working with a consultant, the management of MCC has developed the following probability distribution for x = the number of new clients for marriage counseling for the next year. Excel File: data05-19.xls 10 20 f(x) .05 .10 11 30 40 50 60 .10 .20 .35 .20 a. Is this probability distribution valid? Yes Explain. greater than or equal to 0 f(x) Σf(x) equal to 1 b. What is the probability MCC will obtain more than 30 new clients (to 2 decimals)? c. What is the probability MCC will obtain fewer than 20 new clients (to 2 decimals)? d. Compute the expected value and variance of x. Expected value Variance clients per year squared clients per yeararrow_forwardUse Variation of Parameters to solvearrow_forward
- Use the method of washers to find the volume of the solid that is obtained when the region between the graphs f(x) = √√2 and g(x) = secx over the interval ≤x≤ is rotated about the x-axis.arrow_forward5 Use the method of disks to find the volume of the solid that is obtained when the region under the curve y = over the interval [4,17] is rotated about the x-axis.arrow_forward3. Use the method of washers to find the volume of the solid that is obtained when the region between the graphs f(x) = √√2 and g(x) = secx over the interval ≤x≤ is rotated about the x-axis.arrow_forward
arrow_back_ios
SEE MORE QUESTIONS
arrow_forward_ios
Recommended textbooks for you
 Holt Mcdougal Larson Pre-algebra: Student Edition...AlgebraISBN:9780547587776Author:HOLT MCDOUGALPublisher:HOLT MCDOUGAL
 Glencoe Algebra 1, Student Edition, 9780079039897...AlgebraISBN:9780079039897Author:CarterPublisher:McGraw Hill
 Algebra: Structure And Method, Book 1AlgebraISBN:9780395977224Author:Richard G. Brown, Mary P. Dolciani, Robert H. Sorgenfrey, William L. ColePublisher:McDougal Littell
 Elementary Geometry For College Students, 7eGeometryISBN:9781337614085Author:Alexander, Daniel C.; Koeberlein, Geralyn M.Publisher:Cengage,
Holt Mcdougal Larson Pre-algebra: Student Edition...
Algebra
ISBN:9780547587776
Author:HOLT MCDOUGAL
Publisher:HOLT MCDOUGAL
Glencoe Algebra 1, Student Edition, 9780079039897...
Algebra
ISBN:9780079039897
Author:Carter
Publisher:McGraw Hill
Algebra: Structure And Method, Book 1
Algebra
ISBN:9780395977224
Author:Richard G. Brown, Mary P. Dolciani, Robert H. Sorgenfrey, William L. Cole
Publisher:McDougal Littell
Elementary Geometry For College Students, 7e
Geometry
ISBN:9781337614085
Author:Alexander, Daniel C.; Koeberlein, Geralyn M.
Publisher:Cengage,
Time Series Analysis Theory & Uni-variate Forecasting Techniques; Author: Analytics University;https://www.youtube.com/watch?v=_X5q9FYLGxM;License: Standard YouTube License, CC-BY
Operations management 101: Time-series, forecasting introduction; Author: Brandoz Foltz;https://www.youtube.com/watch?v=EaqZP36ool8;License: Standard YouTube License, CC-BY