
Concept explainers
Videos
The bar graph shows changes in the percentage of collegegraduates for Americans ages 25 and older from 1999 to 2015Exercises 125-126 involve developing arithmetic sequences thatmodel the data
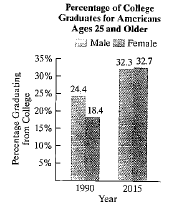
126. In 1999, 24.4% of American men ages 25 and older hadgraduated from college. On average, this percentage hasincreased by approximately 0 3 each year.
a. Write a formula for the nth term of the arithmeticsequence that models the percentage of American menages 25 and older who had graduated from collegen years after 1989.
b. Use the model from part (a) to project the percentage of American men ages 25 and older who will be collegegraduates by 2029.
Want to see the full answer?
Check out a sample textbook solution
Chapter 5 Solutions
THINKING MATHEMATICALLY WITH INTEGRATED


 Algebra & Trigonometry with Analytic GeometryAlgebraISBN:9781133382119Author:SwokowskiPublisher:Cengage
 College Algebra (MindTap Course List)AlgebraISBN:9781305652231Author:R. David Gustafson, Jeff HughesPublisher:Cengage Learning
 Glencoe Algebra 1, Student Edition, 9780079039897...AlgebraISBN:9780079039897Author:CarterPublisher:McGraw Hill