
Concept explainers
Videos
a.
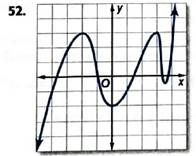
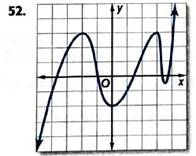
To calculate: the x -coordinate of every turning point and also determine whether the coordinates are
a.
Answer to Problem 52SR
Explanation of Solution
Given information:

Formula used:
Relative maximum- The point on the graph is a relative maximum of the function when there is no other nearby points that have greater y -coordinate.
Relative minimum- The point on the graph is a relative minimum of the function when there is no other nearby points that have lesser y -coordinate.
Calculation:
According to the graph ,
We observed four turning points
At point
At point
At point
At point
Hence, the following are the x -coordinate
b.
To calculate: the x -coordinate of every zero.
b.
Answer to Problem 52SR
The x -coordinate of every zero are
Explanation of Solution
Given information:
Formula used:
The changes in sign indicate that there are zeros between those two x -values.
Calculations:
According to the graph ,
We observed four turning points
The graph crosses the x -axis at five points.
At
Hence, the x -coordinate of every zero are
c.
To calculate: the smallest possible degree of the function.
c.
Answer to Problem 52SR
Smallest degree of the function is 5.
Explanation of Solution
Given information:

Formula used:
The maximum and minimum values of a function are called extrema .
These points are referred to as turning points.
The graph of the polynomial function of degree n has at most
Calculation:
According to the graph ,
We observed four turning points at which the function changes.
Hence, the smallest possible degree of the function is 5.
d.
To calculate: the domain and range of the function .
d.
Answer to Problem 52SR
The domain and range of the function are all real numbers and
Explanation of Solution
Given information:
Formula used:
Domain of the function : is the set of all values for which function is defined.
Range of the function : is the set of all values that f takes.
Calculation:
According to the graph ,
Domain is presented by x -axis. This implies domain is all real numbers.
Range is presented by y -axis. This implies
Hence, the domain and range of the function are all real numbers and
Chapter 5 Solutions
Glencoe Algebra 2 Student Edition C2014
Additional Math Textbook Solutions
A First Course in Probability (10th Edition)
Pre-Algebra Student Edition
Elementary Statistics (13th Edition)
Algebra and Trigonometry (6th Edition)
Elementary Statistics: Picturing the World (7th Edition)


- part 3 of the question is: A power outage occurs 6 min after the ride started. Passengers must wait for their cage to be manually cranked into the lowest position in order to exit the ride. Sine function model: where h is the height of the last passenger above the ground measured in feet and t is the time of operation of the ride in minutes. What is the height of the last passenger at the moment of the power outage? Verify your answer by evaluating the sine function model. Will the last passenger to board the ride need to wait in order to exit the ride? Explain.arrow_forward2. The duration of the ride is 15 min. (a) How many times does the last passenger who boarded the ride make a complete loop on the Ferris wheel? (b) What is the position of that passenger when the ride ends?arrow_forward3. A scientist recorded the movement of a pendulum for 10 s. The scientist began recording when the pendulum was at its resting position. The pendulum then moved right (positive displacement) and left (negative displacement) several times. The pendulum took 4 s to swing to the right and the left and then return to its resting position. The pendulum's furthest distance to either side was 6 in. Graph the function that represents the pendulum's displacement as a function of time. Answer: f(t) (a) Write an equation to represent the displacement of the pendulum as a function of time. (b) Graph the function. 10 9 8 7 6 5 4 3 2 1 0 t 1 2 3 4 5 6 7 8 9 10 11 12 13 14 15 -1 -5. -6 -7 -8 -9 -10-arrow_forward
- A power outage occurs 6 min after the ride started. Passengers must wait for their cage to be manually cranked into the lowest position in order to exit the ride. Sine function model: h = −82.5 cos (3πt) + 97.5 where h is the height of the last passenger above the ground measured in feet and t is the time of operation of the ride in minutes. (a) What is the height of the last passenger at the moment of the power outage? Verify your answer by evaluating the sine function model. (b) Will the last passenger to board the ride need to wait in order to exit the ride? Explain.arrow_forwardThe Colossus Ferris wheel debuted at the 1984 New Orleans World's Fair. The ride is 180 ft tall, and passengers board the ride at an initial height of 15 ft above the ground. The height above ground, h, of a passenger on the ride is a periodic function of time, t. The graph displays the height above ground of the last passenger to board over the course of the 15 min ride. Height of Passenger in Ferris Wheel 180 160 140- €120 Height, h (ft) 100 80 60 40 20 0 ך 1 2 3 4 5 6 7 8 9 10 11 12 13 14 15 Time of operation, t (min) Sine function model: h = −82.5 cos (3πt) + 97.5 where h is the height of the passenger above the ground measured in feet and t is the time of operation of the ride in minutes. What is the period of the sine function model? Interpret the period you found in the context of the operation of the Ferris wheel. Answer:arrow_forward1. Graph the function f(x)=sin(x) −2¸ Answer: y -2π 一元 1 −1 -2 -3 -4+ 元 2πarrow_forward
- 3. Graph the function f(x) = −(x-2)²+4 Answer: f(x) 6 5 4 3 2+ 1 -6-5 -4-3-2-1 × 1 2 3 4 5 6 -1 -2+ ရာ -3+ -4+ -5 -6arrow_forward2. Graph the function f(x) = cos(2x)+1 Answer: -2π 一元 y 3 2- 1 -1 -2+ ရာ -3- Π 2πarrow_forward2. Graph the function f(x) = |x+1+2 Answer: -6-5-4-3-2-1 f(x) 6 5 4 3 2 1 1 2 3 4 5 6 -1 -2 -3 -4 -5 -6arrow_forward
- 1. The table shows values of a function f(x). What is the average rate of change of f(x) over the interval from x = 5 to x = 9? Show your work. X 4 f(x) LO 5 6 7 8 9 10 -2 8 10 11 14 18arrow_forward• Find a real-world situation that can be represented by a sinusoidal function. You may find something online that represents a sinusoidal graph or you can create a sinusoidal graph yourself with a measuring tape and a rope. • Provide a graph complete with labels and units for the x- and y-axes. • Describe the amplitude, period, and vertical shift in terms of the real-world situation.arrow_forwardf(x) = 4x²+6x 2. Given g(x) = 2x² +13x+15 and find 41 (4)(x) Show your work.arrow_forward
 Algebra and Trigonometry (6th Edition)AlgebraISBN:9780134463216Author:Robert F. BlitzerPublisher:PEARSON
 Contemporary Abstract AlgebraAlgebraISBN:9781305657960Author:Joseph GallianPublisher:Cengage Learning
 Linear Algebra: A Modern IntroductionAlgebraISBN:9781285463247Author:David PoolePublisher:Cengage Learning
 Algebra And Trigonometry (11th Edition)AlgebraISBN:9780135163078Author:Michael SullivanPublisher:PEARSON
 Introduction to Linear Algebra, Fifth EditionAlgebraISBN:9780980232776Author:Gilbert StrangPublisher:Wellesley-Cambridge Press
 College Algebra (Collegiate Math)AlgebraISBN:9780077836344Author:Julie Miller, Donna GerkenPublisher:McGraw-Hill Education