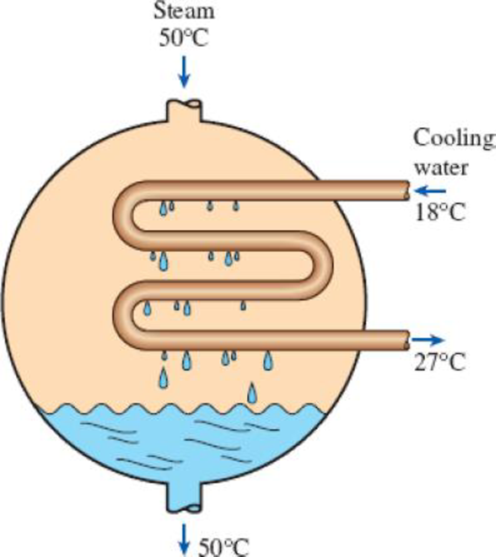
Steam is to be condensed in the condenser of a steam power plant at a temperature of 50°C with cooling water from a nearby lake, which enters the tubes of the condenser at 18°C at a rate of 101 kg/s and leaves at 27°C. Determine the rate of condensation of the steam in the condenser. FIGURE P5–86 5–87 Reconsider Prob. 5–86. Using appropriate software, investigate the effect of the inlet temperature of cooling water on the rate of condensation of steam. Let the inlet temperature vary from 10 to 20°C, and assume the exit temperature to remain constant. Plot the rate of condensation of steam against the inlet temperature of the cooling water, and discuss the results.
Steam is to be condensed in the condenser of a steam power plant at a temperature of 50°C with cooling water from a nearby lake, which enters the tubes of the condenser at 18°C at a rate of 101 kg/s and leaves at 27°C. Determine the rate of condensation of the steam in the condenser. FIGURE P5–86 5–87 Reconsider Prob. 5–86. Using appropriate software, investigate the effect of the inlet temperature of cooling water on the rate of condensation of steam. Let the inlet temperature vary from 10 to 20°C, and assume the exit temperature to remain constant. Plot the rate of condensation of steam against the inlet temperature of the cooling water, and discuss the results.
Solution Summary: The author plots the rate of condensation of steam against the inlet temperature of the cooling water.
Steam is to be condensed in the condenser of a steam power plant at a temperature of 50°C with cooling water from a nearby lake, which enters the tubes of the condenser at 18°C at a rate of 101 kg/s and leaves at 27°C. Determine the rate of condensation of the steam in the condenser.
FIGURE P5–86
5–87 Reconsider Prob. 5–86. Using appropriate software, investigate the effect of the inlet temperature of cooling water on the rate of condensation of steam. Let the inlet temperature vary from 10 to 20°C, and assume the exit temperature to remain constant. Plot the rate of condensation of steam against the inlet temperature of the cooling water, and discuss the results.
The single degree of freedom (SDOF) system that you studied under free vibration in Assignment #3 - Laboratory Component has been subjected to a strong ground motion. The acceleration at the base (excitation) and the acceleration at the roof (response) of the SDOF system was recorded with sampling rate 50 Hz (50 samples per second, or dt= 0.02 seconds). The file ElCentro.txt includes the two columns of acceleration data. The first column lists the acceleration at the base of the SDOF system. The second column lists the acceleration at the roof of the SDOF system. (a) Plot the time histories of the recorded accelerations at the base and at the roof of the SDOF system. (b) Compute the acceleration, velocity and displacement time histories of the roof of the SDOF system subjected to the recorded base acceleration using the Central Difference method. Plot the accel- eration, velocity and displacement time histories. Plot the restoring force, the damping force, and the inertia force time…
The single degree of freedom (SDOF) system that you studied under free vibration in Assignment #3 - Laboratory Component has been subjected to a strong ground motion. The acceleration at the base (excitation) and the acceleration at the roof (response) of the SDOF system was recorded with sampling rate 50 Hz (50 samples per second, or dt= 0.02 seconds). The file ElCentro.txt includes the two columns of acceleration data. The first column lists the acceleration at the base of the SDOF system. The second column lists the acceleration at the roof of the SDOF system. (a) Plot the time histories of the recorded accelerations at the base and at the roof of the SDOF system. (b) Compute the acceleration, velocity and displacement time histories of the roof of the SDOF system subjected to the recorded base acceleration using the Central Difference method. Plot the accel- eration, velocity and displacement time histories. Plot the restoring force, the damping force, and the inertia force time…
A tensile specimen made of hot-rolled AISI 1020 steel is loaded to point corresponding to a strain of 43%.
60
Su = 66 ksi
Stress σ (ksi)
40 B
20
0
0
0
T
H
Sy = 39 ksi
Se = 36 ksi
Hot-rolled 1020 steel
F
10 20 30 40
50 60 70 80 90 100 110 120 130 140 150 160
Strain € (%)
T
1.1 1.2 1.3 1.4 1.5 1.6 1.7 1.8 1.9 2.0 2.1 2.2 2.3 2.4 2.5 2.6
Area ratio R
0.1
0.2
0.3
0.4
0.5
Area reduction A,
What value of strain is applicable to this location?
0.6
Chapter 5 Solutions
Thermodynamics: An Engineering Approach ( 9th International Edition ) ISBN:9781260092684
Need a deep-dive on the concept behind this application? Look no further. Learn more about this topic, mechanical-engineering and related others by exploring similar questions and additional content below.


 Elements Of ElectromagneticsMechanical EngineeringISBN:9780190698614Author:Sadiku, Matthew N. O.Publisher:Oxford University Press
 Mechanics of Materials (10th Edition)Mechanical EngineeringISBN:9780134319650Author:Russell C. HibbelerPublisher:PEARSON
 Thermodynamics: An Engineering ApproachMechanical EngineeringISBN:9781259822674Author:Yunus A. Cengel Dr., Michael A. BolesPublisher:McGraw-Hill Education
 Control Systems EngineeringMechanical EngineeringISBN:9781118170519Author:Norman S. NisePublisher:WILEY
 Mechanics of Materials (MindTap Course List)Mechanical EngineeringISBN:9781337093347Author:Barry J. Goodno, James M. GerePublisher:Cengage Learning
 Engineering Mechanics: StaticsMechanical EngineeringISBN:9781118807330Author:James L. Meriam, L. G. Kraige, J. N. BoltonPublisher:WILEY