Concept explainers
Hot air balloons
Rot all ballooning is a relaxing. peaceful pastime that many people enjoy. Many balloonist gatherings take place around the world, Such as the Albuquerque International Balloon Fiesta. The Albuquerque event is the largest hot air balloon festival in the world, with ovet 500 balloons participating each year.

Figure 5.61 Balloons lift off at the 2001 Albuquerque international Balloon Fiesta. (credit: David Herrera, Flickr)
As the name implies, hot air balloons use hot air to generate lift. (Hot air is less dense than cooler air, so the balloon floats as long as the hot air stays hot.) The heat is generated by a propane burner suspended below the opening of the basket. Once the balloon takes off, the pilot controls the altitude of the balloon, either by using the burner to heat the air and ascend or by using a vent near the top of the balloon to release heated air and descend. The pilot has very little control over where the balloon goes, however—balloons are at the mercy of the winds. The uncertainty over where we will end up is one of the reasons balloonists are attracted to the sport.
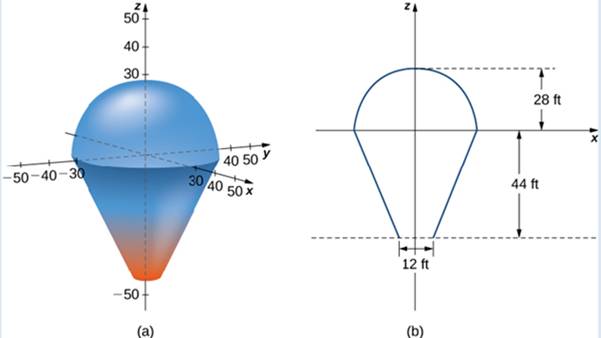
In this project we use tnple integrals to learn more about hot air balloons. We model the balloon in two pieces. The top of the balloon is modeled by a half sphere of radius 28 feet. The bottom of the balloon is modeled by a fnistum of a cone (think of an ice cream cone with the pointy end cut off). The radius of the large end of the fnistum is 28 feet and the radius of the small end of the fnistum is 6 feet. A graph of our balloon model and a cross-sectional diagram showing the dimensions are shown in the following figure.

FIgure 5.62 (a)Useahalfsphetetomodeltheroppartoftheballoonandafrnsnunofaconeomodel
the bonom pan of the balloon. (b) A cross section of the balloon shong its dimensions.
Trending nowThis is a popular solution!

Chapter 5 Solutions
Calculus Volume 3
Additional Math Textbook Solutions
Elementary Statistics: Picturing the World (7th Edition)
University Calculus: Early Transcendentals (4th Edition)
Calculus: Early Transcendentals (2nd Edition)
A Problem Solving Approach To Mathematics For Elementary School Teachers (13th Edition)
Elementary Statistics (13th Edition)
- The graph of f' is below. Use it to determine where the local minima and maxima for f are. If there are multiple answers, separate with commas. f'(x) 4- -5-4-3-8-1 3 2 1 x 1 2 3 4 5 -1 -2 -3 -4 Local minima at a Local maxima at =arrow_forwardThe graph of f' is below. Use it to determine the intervals where f is increasing. f'(xx) 4- -5 -3 -2 3 2 1 1 2 3 4 5 Cit +x 7 2arrow_forwardI need help with number 5.arrow_forward
- Let W be a subspace spanned by the u's, and write y as the sum of a vector in W and a vector orthogonal to W. 2 1 -1 - 1 5 0 y= u1 Աշ U3 = 1 1 1 - 4 1 y= (Type an integer or simplified fraction for each matrix element.) ...arrow_forward3) Use the following system of linear inequalities graphed below to answer the questions. a) Use the graph to write the symbolic form of the system of linear inequalities. b) Is (-4,2) a solution to the system? Explain. 5 -7 -5 -3 -2 0 2 3 4 $ 6 -2 -6 -7arrow_forward) Graph the feasible region subject to the following constraints. x + y ≤ 6 y ≤ 2x x ≥ 0, y ≥ 0 P + xarrow_forward
- Business Discussarrow_forwardProblem 2: In the slider-crank mechanism shown, r = 3 in and L = 8 in. If the crank AB rotates with a constant angular velocity of 750 rpm clockwise, determine the velocity and acceleration of the piston P and the angular velocity and angular acceleration of the coupler BD when 0 = 40°. B 40° B D Parrow_forwardProblem 1: In a 4-bar mechanism shown, the link AB has an angular velocity of 10 rad/s and an angular acceleration of 2 rad/s² (both clockwise), determine the angular velocity and angular acceleration of: (a) link BD, (b) link DE. Bonus: Develop a MATLAB program to solve for this problem. B J 0 A 20 Unit: cm D 7.5 10 Earrow_forward
- Triola statistics Readers who prefer printed books Readers who prefer e-booksarrow_forwardThe following is a list of data on the duration of a sample of 200 outbreaks, in hours. 107 73 68 97 76 79 94 59 98 57 54 65 71 70 84 88 62 82 61 79 98 66 62 79 86 68 74 61 62 116 65 88 64 79 78 74 92 75 5289 85 28 73 80 68 78 89 72 78 88 77 103 88 63 68 90 62 89 71 71 74 222 R 82 79 70 ST☑ 65 98 77 86 58 69 88 81 74 70 65 81 75 81 78 90 78 96 75 KRRE F S 62 94 62 79 83 93 135 71 85 84 83 63 61 65 83 70 70 81 77 72 84 33 62 92 65 67 59 58 66 66 94 77 63 71 101 78 43 78 66 75 68 76 59 67 61 71 64 76 72 77 74 65 82 86 66 86 68 85 27% 96 72 77 60 67 87 83 68 72 74 91 76 83 งงง 8 སྐྱ ཐྭ ༄ ཏྱཾ 89 81 71 85 99 59 92 87 84 75 77 51 45 80 84 93 69 76 89 75 67 92 89 82 96 77 102 66 68 61 73 72 76 73 77 79 94 63 59 62 71 81 65 73 63 63 89 82 64 85 92 64 73 a. What is the variable? What type? b. Construct an interval-frequency table, with columns containing: class mark, absolute frequency, relative frequency, cumulative frequency, cumulative relative frequency, and percentage frequency.arrow_forwardThis is the information about the actors who won the Best Actor Oscar: Best actors 44 41 62 52 41 34 34 52 41 37 38 34 32 40 43 56 41 39 49 57 35 30 39 41 44 41 38 42 52 51 49 35 47 31 47 37 57 42 45 42 44 62 43 42 48 49 56 38 60 30 40 42 36 76 39 53 45 36 62 43 51 32 42 54 52 37 38 32 45 60 46 40 36 47 29 43 a. What is the variable? What type? b. Construct an interval-frequency table, with columns containing: class mark, absolute frequency, relative frequency, cumulative frequency, cumulative relative frequency, and percentage frequency.arrow_forward
 Holt Mcdougal Larson Pre-algebra: Student Edition...AlgebraISBN:9780547587776Author:HOLT MCDOUGALPublisher:HOLT MCDOUGAL
 Algebra: Structure And Method, Book 1AlgebraISBN:9780395977224Author:Richard G. Brown, Mary P. Dolciani, Robert H. Sorgenfrey, William L. ColePublisher:McDougal Littell
 Big Ideas Math A Bridge To Success Algebra 1: Stu...AlgebraISBN:9781680331141Author:HOUGHTON MIFFLIN HARCOURTPublisher:Houghton Mifflin Harcourt
- Algebra & Trigonometry with Analytic GeometryAlgebraISBN:9781133382119Author:SwokowskiPublisher:Cengage


