
Videos
Tosolve:The given equation
Answer to Problem 14CYU

Explanation of Solution
Given information:
Concept Used:
When two quantities are not equal, the comparison between them is often presented by certain symbols, this comparison is known as inequality and the symbols used for such comparison are known as inequality symbols.
There are four inequality symbols,
On a number line, integers are placed at an interval of one and value if integers increases as we move left to right on the number line.
Calculation:
Graph:
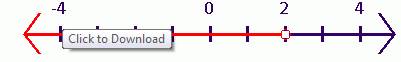
In the inequality
We will make an open dot on 2 as it is not included in the inequality and then move towards left as
Chapter 5 Solutions
Pre-Algebra Student Edition
Additional Math Textbook Solutions
Thinking Mathematically (6th Edition)
Basic Business Statistics, Student Value Edition
Elementary Statistics (13th Edition)
College Algebra (7th Edition)
Elementary Statistics: Picturing the World (7th Edition)


- Consider the table of values below. x y 2 64 3 48 4 36 5 27 Fill in the right side of the equation y= with an expression that makes each ordered pari (x,y) in the table a solution to the equation.arrow_forwardsolving for xarrow_forwardConsider the table of values below. x y 2 63 3 70 4 77 5 84 Fill in the right side of the equation y= with an expression that makes each ordered pari (x,y) in the table a solution to the equation.arrow_forward
- There were 426 books sold in one week. The number of biology books sold was 5 times that of the number of psychology books. How many books each were sold?arrow_forwardPopulation decreases 5% each year. Starts with a starting population of 3705. Find that population after 5 years.arrow_forwardsolve using substitution -2x-3y=-15 -3x+9y=12arrow_forward
- Suppose that 7000 is placed in an accout that pays 4% interest. Interest compunds each year. Assume that no withdraws are made. How much would the account have after 1 year? And how much would the account have after 2 years?arrow_forwardUse substitution to solve the equations -2x+5y=18 x=2y-8arrow_forward5) For each function represented by an equation, make a table and plot the corresponding points to sketch the graph of the function. (a) y = 75 ()* 220 X y 200- -2 180 160 -1 140 0 120 100 1 60 80 2 3 4 x (b) y = 20 ()* 1 60 40 20 20 0 2 3 65- -1 X y 60 -2 55- 50 45 44 40 0 35- 30 1 25 2 20 20 15 3 10 5 LO 4 3-2 T -1 0 5- 4- -3- 2-arrow_forward
- A system of inequalities is shown. y 5 3 2 1 X -5 -4 -3 -2 -1 0 1 2 3 4 5 -1- Which system is represented in the graph? Oy>-x²-x+1 y 2x²+3 -2 -3 тarrow_forwardWhich set of systems of equations represents the solution to the graph? -5 -4 -3 -2 Of(x) = x² + 2x + 1 g(x) = x²+1 f(x) = x²+2x+1 g(x) = x²-1 f(x) = −x² + 2x + 1 g(x) = x²+1 f(x) = x² + 2x + 1 g(x) = x²-1 -1 5 y 4 3 2 1 0 -1- -2 -3- -4. -5 1 2 3 4 5arrow_forwardWhich of the graphs below correctly solves for x in the equation -x² - 3x-1=-x-4? о 10 8 (0,2) -10 -8 -6 -2 2 4 6 8 10 (-4,-2) -2 + (0,2) (4,6) -10-8-6-4-2 -2 2 4 6 8 10 (-3, -1) -2 2 (1-5) -6 -8 -10 10 -10-8-6-4-2 2 6 8 10 (2,0)arrow_forward
 Algebra and Trigonometry (6th Edition)AlgebraISBN:9780134463216Author:Robert F. BlitzerPublisher:PEARSON
 Contemporary Abstract AlgebraAlgebraISBN:9781305657960Author:Joseph GallianPublisher:Cengage Learning
 Linear Algebra: A Modern IntroductionAlgebraISBN:9781285463247Author:David PoolePublisher:Cengage Learning
 Algebra And Trigonometry (11th Edition)AlgebraISBN:9780135163078Author:Michael SullivanPublisher:PEARSON
 Introduction to Linear Algebra, Fifth EditionAlgebraISBN:9780980232776Author:Gilbert StrangPublisher:Wellesley-Cambridge Press
 College Algebra (Collegiate Math)AlgebraISBN:9780077836344Author:Julie Miller, Donna GerkenPublisher:McGraw-Hill Education