
Videos
Tograph:Given inequality on the number line.
Answer to Problem 5BGP
Explanation of Solution
Given information:
Concept Used:
When two quantities are not equal, the comparison between them is often presented by certain symbols, this comparison is known as inequality and the symbols used for such comparison are known as inequality symbols.
There are four inequality symbols,
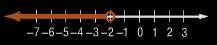
On a number line, integers are placed at an interval of one and value if integers increases as we move left to right on the number line.
Graph:
Let us assume that graph is moving towards
In the given graph we can say that -2 is included in the inequality as it has a open dot, also the graph is moving towards left with means
Therefore, the inequality will be-
Chapter 5 Solutions
Pre-Algebra Student Edition
Additional Math Textbook Solutions
Algebra and Trigonometry (6th Edition)
Thinking Mathematically (6th Edition)
Elementary Statistics
A First Course in Probability (10th Edition)
Elementary Statistics: Picturing the World (7th Edition)


- There were 426 books sold in one week. The number of biology books sold was 5 times that of the number of psychology books. How many books each were sold?arrow_forwardPopulation decreases 5% each year. Starts with a starting population of 3705. Find that population after 5 years.arrow_forwardsolve using substitution -2x-3y=-15 -3x+9y=12arrow_forward
- Suppose that 7000 is placed in an accout that pays 4% interest. Interest compunds each year. Assume that no withdraws are made. How much would the account have after 1 year? And how much would the account have after 2 years?arrow_forwardUse substitution to solve the equations -2x+5y=18 x=2y-8arrow_forward5) For each function represented by an equation, make a table and plot the corresponding points to sketch the graph of the function. (a) y = 75 ()* 220 X y 200- -2 180 160 -1 140 0 120 100 1 60 80 2 3 4 x (b) y = 20 ()* 1 60 40 20 20 0 2 3 65- -1 X y 60 -2 55- 50 45 44 40 0 35- 30 1 25 2 20 20 15 3 10 5 LO 4 3-2 T -1 0 5- 4- -3- 2-arrow_forward
- A system of inequalities is shown. y 5 3 2 1 X -5 -4 -3 -2 -1 0 1 2 3 4 5 -1- Which system is represented in the graph? Oy>-x²-x+1 y 2x²+3 -2 -3 тarrow_forwardWhich set of systems of equations represents the solution to the graph? -5 -4 -3 -2 Of(x) = x² + 2x + 1 g(x) = x²+1 f(x) = x²+2x+1 g(x) = x²-1 f(x) = −x² + 2x + 1 g(x) = x²+1 f(x) = x² + 2x + 1 g(x) = x²-1 -1 5 y 4 3 2 1 0 -1- -2 -3- -4. -5 1 2 3 4 5arrow_forwardWhich of the graphs below correctly solves for x in the equation -x² - 3x-1=-x-4? о 10 8 (0,2) -10 -8 -6 -2 2 4 6 8 10 (-4,-2) -2 + (0,2) (4,6) -10-8-6-4-2 -2 2 4 6 8 10 (-3, -1) -2 2 (1-5) -6 -8 -10 10 -10-8-6-4-2 2 6 8 10 (2,0)arrow_forward
- 1) Express these large and small numbers from the Read and Study section in scientific notation: (a) 239,000 miles (b) 3,800,000,000,000 sheets of paper (c) 0.0000000000000000000000167 grams 2) Find all values for the variable x that make these equations true. (a) 5x = 1 (b) 3x = 1/1 9 (c) 4* = 11/ 4 (e) 4* = 64 (g) 10x = 1,000,000 (d) 3x=-3 (f) 2x = = 8 (h) 10x = 0.001arrow_forward(b) 4) Find an equation to fit each of the following graphs: (a) 20 20 18 16 14 12 10 8 6 4 2 24 22 20 18 16 14 12 10 8 16 A 2 -3 -2 -1-0 2 3 4. -1 0 1 2 3. -2 -2arrow_forward3) Which of the following are equivalent to 3? (There may be more than one that is equivalent!) -1 (a) (9)¯¹ 3. (b) (-3)-1 (c) (-3) -1 (d) -(¯3) (e) 11 3-1 (f) 3-4arrow_forward
 Algebra and Trigonometry (6th Edition)AlgebraISBN:9780134463216Author:Robert F. BlitzerPublisher:PEARSON
 Contemporary Abstract AlgebraAlgebraISBN:9781305657960Author:Joseph GallianPublisher:Cengage Learning
 Linear Algebra: A Modern IntroductionAlgebraISBN:9781285463247Author:David PoolePublisher:Cengage Learning
 Algebra And Trigonometry (11th Edition)AlgebraISBN:9780135163078Author:Michael SullivanPublisher:PEARSON
 Introduction to Linear Algebra, Fifth EditionAlgebraISBN:9780980232776Author:Gilbert StrangPublisher:Wellesley-Cambridge Press
 College Algebra (Collegiate Math)AlgebraISBN:9780077836344Author:Julie Miller, Donna GerkenPublisher:McGraw-Hill Education