Concept explainers
Videos
a.
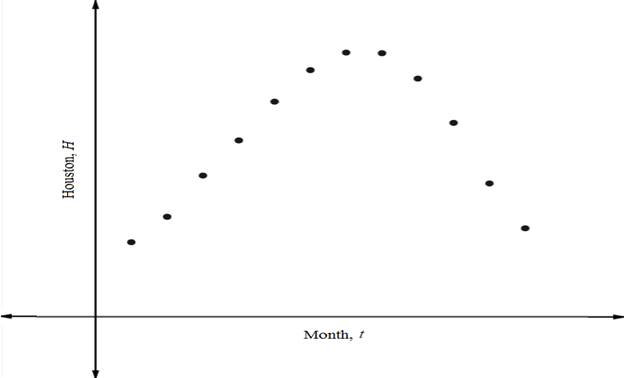
To plot: The data on graph.
a.
Answer to Problem 93E
Explanation of Solution
Given:The table shows the normal daily high temperatures in Houston H (in degree Fahrenheit) for month t, with
Plot the points on graph using scatter creator.
b.
To find: The cosine model.
b.
Answer to Problem 93E
Explanation of Solution
Given: The table shows the normal daily high temperatures in Houston H (in degree Fahrenheit) for month t, with
First trace the all the points and then find the cosine function.
So, cosine function will be
c.
To fit: The model and data plot on graph
c.
Explanation of Solution
Given: The table shows the normal daily high temperatures in Houston H (in degree Fahrenheit) for month t, with
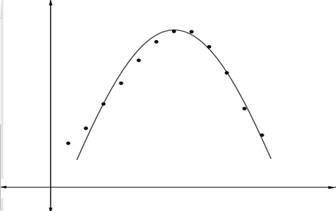
Best fit
d.
To find: The overall normal daily high temperature.
d.
Explanation of Solution
Given: The table shows the normal daily high temperatures in Houston H (in degree Fahrenheit) for month t, with
The coefficient of cosine model is normal daily high temperature.
Hence, the overall normal daily temperature
e.
To find: The months during which the normal daily high temperature is above
e.
Answer to Problem 93E
Below
Above
Explanation of Solution
Given: The table shows the normal daily high temperatures in Houston H (in degree Fahrenheit) for month t, with
The coefficient of cosine model is normal daily high temperature.
First check the months below
Months: October through May
Months above
Months: June through September
Chapter 5 Solutions
Precalculus with Limits


- Morgan F. - C X A Courses MindTap - Cengage Learning Х Domain of Square Roots X + gage.com/static/nb/ui/evo/index.html?elSBN 9780357038406&id=339416021&snapshotld=877369& CENGAGE MINDTAP 2: Functions, Limits, and the Derivative 47. x if x < 0 f(x) = 2x+1 if x 0 Answerarrow_forwardA Content MindTap - Cengage Learning × Function Evaluations * + c/nb/ui/evo/index.html?elSBN 9780357038406&id=339416021&snapshotld=877369& GAGE MINDTAP ions, Limits, and the Derivative 15. Refer to the graph of the function f in the following figure. 6 y = f(x) 5 4+ 3- 2- 1 + 2 -1 3 4 5 6 a. Find the value of ƒ (0). Answer-> b. Find the value of x for which (i) f (x) = 3 and (ii) f (x) = 0. Answer ▾ c. Find the domain of f. Answer + d. Find the range of f. Answer+ MacBook Proarrow_forwardAnswer-> 12. Let g be the function defined by Find g(-2), g(0), g (2), and g (4). - +1 if x <2 g(x) = √√√x-2 if x 2arrow_forward
- 13. Let f be the function defined by Find f (-1), f (0), ƒ (1) and ƒ (2). Answer f(x) = .2 J-x² +3 if x <1 2x²+1 2x²+1 if x ≥ 1arrow_forwardΛ Content Mind Tap - Cengage Learning × Function Evaluations x + c/nb/ui/evo/index.html?elSBN 9780357038406&id=339416021&snapshotld=877369& GAGE MINDTAP ons, Limits, and the Derivative 14. Let f be the function defined by Find f (0), f (1), and f (2). 2+1 x if x 1 if x 1 f(x) = 1 1-xarrow_forwardA Content c/nb/ui/evo/index.html?elSBN 9780357038406&id=339416021&snapshotld=877369& GAGE MINDTAP ons, Limits, and the Derivative 11. Let f be the function defined by Find f (-2), f (0), and f (1). Answer f(x) = [ x² + 1 if x ≤ 0 if x > 0arrow_forward
- Given that 4−4i is a zero, factor the following polynomial function completely. Use the Conjugate Roots Theorem, if applicable. f(x)=x4−5x3−2x2+176x−320arrow_forwardeliminate the parameter to find the cartesian equation of the curve and sketch the graph. On the graph show the direction it takes and the initial and terminal point. Please draw by hand and show how you got to each steparrow_forwardeliminate the parameter to find the cartesian equation of the curve and sketch the graph. On the graph show the direction it takes and the initial and terminal point. Please draw by hand and show how you got to each steparrow_forward
- eliminate the parameter to find the cartesian equation of the curve and sketch the graph. On the graph show the direction it takes and the initial and terminal point. Please draw by hand and show how you got to each steparrow_forwardeliminate the parameter to find the cartesian equation of the curve and sketch the graph. On the graph show the direction it takes and the initial and terminal point. Please draw by hand and show how you got to each steparrow_forwardGraphically, explain the various forms of linear functionsarrow_forward
 Calculus: Early TranscendentalsCalculusISBN:9781285741550Author:James StewartPublisher:Cengage Learning
 Thomas' Calculus (14th Edition)CalculusISBN:9780134438986Author:Joel R. Hass, Christopher E. Heil, Maurice D. WeirPublisher:PEARSON
 Calculus: Early Transcendentals (3rd Edition)CalculusISBN:9780134763644Author:William L. Briggs, Lyle Cochran, Bernard Gillett, Eric SchulzPublisher:PEARSON
 Calculus: Early TranscendentalsCalculusISBN:9781319050740Author:Jon Rogawski, Colin Adams, Robert FranzosaPublisher:W. H. Freeman
 Calculus: Early Transcendental FunctionsCalculusISBN:9781337552516Author:Ron Larson, Bruce H. EdwardsPublisher:Cengage Learning