
Concept explainers
Videos
Let’s eat: A fast-food restaurant chain has 600 outlets in the United States. The following table categorizes them by city population size and location; and presents the number of restaurants in each category. A restaurant is to be chosen at random from the 600 to test market a new menu.
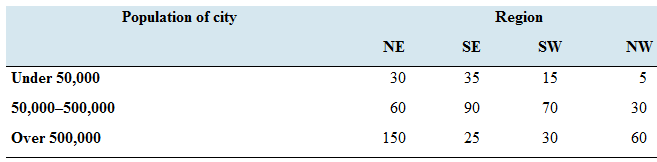
Given that the restaurant is located in a city with a population over 500,000, what is die
Given that the restaurant is located in the Southeast, what is the probability that it is in a city with a population under 50,000?
Given that the restaurant is located in the Southwest what is the probability that it is in a city with a population of 500,000 or less?
Given that the restaurant is located in a city with a population of 500,000 or less, what is the probability that it is in the Southwest?
Given that the restaurant is located in the South (either SE or SW), what is the probability that it is in a city with a population of 50,000 or more?
(a)
The probability that the restaurant is in Northeast, it is given that restaurant is located in a city with a population over 500,000.
Answer to Problem 39E
Explanation of Solution
Given:
The following table categorizes 600 outlets of China restaurant by city population, size, and location.
| Population Of City | NE | SE | SW | NW |
| Under 50,000 | 30 | 35 | 15 | 5 |
| 50,000-500,000 | 60 | 90 | 70 | 30 |
| Over 500,000 | 150 | 25 | 30 | 60 |
Formula Used:
Probability of an event is given by
For any two dependent events
Where
Calculation:
Let
Let
So,
Therefore,
So, the probability of the event “the restaurant is in Northeast, it is given that restaurant is located in a city with a population over 500,000” is calculated as follows:
Hence, the probability of the event thatthe restaurant is in Northeast, it is given that restaurant is located in a city with a population over 500,000 is
(b)
The probability restaurant is located in a city with a population under 50,000 it is given that the restaurant is located in the Southeast.
Answer to Problem 39E
Explanation of Solution
Given:
The following table categorizes 600 outlets of China restaurant by city population, size, and location.
| Population Of City | NE | SE | SW | NW |
| Under 50,000 | 30 | 35 | 15 | 5 |
| 50,000-500,000 | 60 | 90 | 70 | 30 |
| Over 500,000 | 150 | 25 | 30 | 60 |
Formula Used:
Probability of an event is given by
For any two dependent events
Where
Calculation:
Let
Let
So,
Therefore,
So, the probability of the event “restaurant is located in a city with a population under 50,000 it is given that the restaurant is located in the Southeast” is calculated as follows:
Hence, the probability restaurant is located in a city with a population under 50,000 it is given that the restaurant is located in the Southeastis
(c)
The probability that the city has a population 500,000 or less, given that restaurant is located in Southwest.
Answer to Problem 39E
The probability that the city has a population 500,000 or less, given that restaurant is located in Southwest is
Explanation of Solution
Given:
The following table categorizes 600 outlets of China restaurant by city population, size, and location.
| Population Of City | NE | SE | SW | NW |
| Under 50,000 | 30 | 35 | 15 | 5 |
| 50,000-500,000 | 60 | 90 | 70 | 30 |
| Over 500,000 | 150 | 25 | 30 | 60 |
Formula Used:
Probability of an event is given by
For any two dependent events
Where
Calculation:
Let
Let
So,
Therefore,
So, the probability of the event that the city has a population 500,000 or less, given that restaurant is located in Southwest” is calculated as follows:
Hence, the probability that the city has a population 500,000 or less, given that restaurant is located in Southwest is
(d)
The probability that the restaurant is in Southwest, it is given that restaurant is located in a city with a population 500,000 or less.
Answer to Problem 39E
Explanation of Solution
Given:
The following table categorizes 600 outlets of China restaurant by city population, size, and location.
| Population Of City | NE | SE | SW | NW |
| Under 50,000 | 30 | 35 | 15 | 5 |
| 50,000-500,000 | 60 | 90 | 70 | 30 |
| Over 500,000 | 150 | 25 | 30 | 60 |
Formula Used:
Probability of an event is given by
For any two dependent events
Where
Calculation:
Let
Let
So,
Therefore,
So, the probability of the event “the restaurant is in Southwest, it is given that restaurant is located in a city with a population 500,000 or less” is calculated as follows:
Hence, the probability of the event thatthe restaurant is in Southwest, it is given that restaurant is located in a city with a population 500,000 or less is
(e)
The probability that the city has a population 50,000 or more, given that restaurant is located in South.
Answer to Problem 39E
The probability that the city has a population 50,000 or more, given that restaurant is located in Southis
Explanation of Solution
Given:
The following table categorizes 600 outlets of China restaurant by city population, size, and location.
| Population Of City | NE | SE | SW | NW |
| Under 50,000 | 30 | 35 | 15 | 5 |
| 50,000-500,000 | 60 | 90 | 70 | 30 |
| Over 500,000 | 150 | 25 | 30 | 60 |
Formula Used:
Probability of an event is given by
For any two dependent events
Where
Calculation:
Let
Let
So,
Therefore,
So, the probability of the event that that “the city has a population 50,000 or more, given that restaurant is located in South” is calculated as follows:
Hence, the probability that that the city has a population 50,000 or more, given that restaurant is located in South is
Want to see more full solutions like this?
Chapter 5 Solutions
Elementary Statistics (Text Only)


- Given your fitted regression line, what would be the residual for snake #5 (10 C)?arrow_forwardCalculate the 95% confidence interval around your estimate of r using Fisher’s z-transformation. In your final answer, make sure to back-transform to the original units.arrow_forwardCalculate Pearson’s correlation coefficient (r) between temperature and heart rate.arrow_forward
- A researcher wishes to estimate, with 90% confidence, the population proportion of adults who support labeling legislation for genetically modified organisms (GMOs). Her estimate must be accurate within 4% of the true proportion. (a) No preliminary estimate is available. Find the minimum sample size needed. (b) Find the minimum sample size needed, using a prior study that found that 65% of the respondents said they support labeling legislation for GMOs. (c) Compare the results from parts (a) and (b). ... (a) What is the minimum sample size needed assuming that no prior information is available? n = (Round up to the nearest whole number as needed.)arrow_forwardThe table available below shows the costs per mile (in cents) for a sample of automobiles. At a = 0.05, can you conclude that at least one mean cost per mile is different from the others? Click on the icon to view the data table. Let Hss, HMS, HLS, Hsuv and Hмy represent the mean costs per mile for small sedans, medium sedans, large sedans, SUV 4WDs, and minivans respectively. What are the hypotheses for this test? OA. Ho: Not all the means are equal. Ha Hss HMS HLS HSUV HMV B. Ho Hss HMS HLS HSUV = μMV Ha: Hss *HMS *HLS*HSUV * HMV C. Ho Hss HMS HLS HSUV =μMV = = H: Not all the means are equal. D. Ho Hss HMS HLS HSUV HMV Ha Hss HMS HLS =HSUV = HMVarrow_forwardQuestion: A company launches two different marketing campaigns to promote the same product in two different regions. After one month, the company collects the sales data (in units sold) from both regions to compare the effectiveness of the campaigns. The company wants to determine whether there is a significant difference in the mean sales between the two regions. Perform a two sample T-test You can provide your answer by inserting a text box and the answer must include: Null hypothesis, Alternative hypothesis, Show answer (output table/summary table), and Conclusion based on the P value. (2 points = 0.5 x 4 Answers) Each of these is worth 0.5 points. However, showing the calculation is must. If calculation is missing, the whole answer won't get any credit.arrow_forward

 Algebra & Trigonometry with Analytic GeometryAlgebraISBN:9781133382119Author:SwokowskiPublisher:Cengage
 Holt Mcdougal Larson Pre-algebra: Student Edition...AlgebraISBN:9780547587776Author:HOLT MCDOUGALPublisher:HOLT MCDOUGAL
 College AlgebraAlgebraISBN:9781305115545Author:James Stewart, Lothar Redlin, Saleem WatsonPublisher:Cengage Learning
 College Algebra (MindTap Course List)AlgebraISBN:9781305652231Author:R. David Gustafson, Jeff HughesPublisher:Cengage Learning
 Algebra and Trigonometry (MindTap Course List)AlgebraISBN:9781305071742Author:James Stewart, Lothar Redlin, Saleem WatsonPublisher:Cengage Learning