
Concept explainers
Videos
The following table is a life table, reproduced from the chapter introduction .With an understanding of some basic concepts of
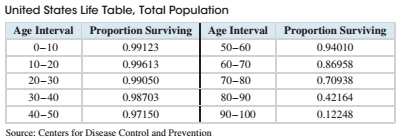
The column labeled “Proportion Surviving” gives the proportion of people alive at the beginning of an age interval who will still be alive at the end of the age interval. For example, among those currently age 20, the proportion who will still be alive age 30 is 0.99050 or 99.050%. We will begin by computing the probability that a person lives to any of the ages 10, 20…, 100.
The first number in the column is the probability that a person lives to a age 10. So P (Alive at age10) = 0.99123
The key to using the life table is to realize that the rest of the numbers in the “Proportion Surviving “column are conditional probabilities. They are probabilities that a person is alive at the end of the age interval, given that they were alive at the beginning of the age interval. For example, the row Labeled 20—30 contains the conditional probability that someone alive at age 20 will be alive at Age of 30.
P (Alive at age 30|Alive at age 20) = 0.99050
In exercise 1—5, compute the probability that a person lives to a given age.
From the table, find the conditional probability P (Alive at age 20 | Alive at age 10).
Want to see the full answer?
Check out a sample textbook solution
Chapter 5 Solutions
Elementary Statistics (Text Only)


- A company found that the daily sales revenue of its flagship product follows a normal distribution with a mean of $4500 and a standard deviation of $450. The company defines a "high-sales day" that is, any day with sales exceeding $4800. please provide a step by step on how to get the answers in excel Q: What percentage of days can the company expect to have "high-sales days" or sales greater than $4800? Q: What is the sales revenue threshold for the bottom 10% of days? (please note that 10% refers to the probability/area under bell curve towards the lower tail of bell curve) Provide answers in the yellow cellsarrow_forwardFind the critical value for a left-tailed test using the F distribution with a 0.025, degrees of freedom in the numerator=12, and degrees of freedom in the denominator = 50. A portion of the table of critical values of the F-distribution is provided. Click the icon to view the partial table of critical values of the F-distribution. What is the critical value? (Round to two decimal places as needed.)arrow_forwardA retail store manager claims that the average daily sales of the store are $1,500. You aim to test whether the actual average daily sales differ significantly from this claimed value. You can provide your answer by inserting a text box and the answer must include: Null hypothesis, Alternative hypothesis, Show answer (output table/summary table), and Conclusion based on the P value. Showing the calculation is a must. If calculation is missing,so please provide a step by step on the answers Numerical answers in the yellow cellsarrow_forward
 Holt Mcdougal Larson Pre-algebra: Student Edition...AlgebraISBN:9780547587776Author:HOLT MCDOUGALPublisher:HOLT MCDOUGAL
 College Algebra (MindTap Course List)AlgebraISBN:9781305652231Author:R. David Gustafson, Jeff HughesPublisher:Cengage Learning
