
Concept explainers
Videos
Unsanitary Restaurants
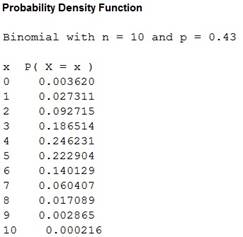
Health officials routinely check the sanitary condition of restaurants. Assume you visit a popular tourist spot and read in the newspaper that in 3 out of every 7 restaurants checked, unsatisfactory health conditions were found. Assuming you are planning to eat out 10 times while you are there on vacation, answer the following questions.
1. How likely is it that you will eat at three restaurants with unsanitary conditions?
2. How likely is it that you will eat at four or five restaurants with unsanitary conditions?
3. Explain how you would compute the
4. What is the most likely number to occur in this experiment?
5. How variable will the data be around the most likely number?
6. How do you know that this is a binomial distribution?
7. If it is a binomial distribution, does that
Mean = 4.29 Std. dev. = 1.56492
| X | P(X) | Cum. prob. |
| 0 | 0.00371 | 0.00371 |
| 1 | 0.02784 | 0.03155 |
| 2 | 0.09396 | 0.12552 |
| 3 | 0.18793 | 0.31344 |
| 4 | 0.24665 | 0.56009 |
| 5 | 0.22199 | 0.78208 |
| 6 | 0.13874 | 0.92082 |
| 7 | 0.05946 | 0.98028 |
| 8 | 0.01672 | 0.99700 |
| 9 | 0.00279 | 0.99979 |
| 10 | 0.00021 | 1.00000 |
a.
The probability that the person is likely to eat at all three restaurants with unsanitary conditions.
Answer to Problem 1AC
The probability the person is likely to eat at all three restaurants with unsanitary conditions is 0.186.
Explanation of Solution
Given info:
A person is planning to eat outside 10 times during a vacation. Health officials checks the sanitary condition of restaurant and found that every 3 out of 7 restaurants checked was having an unsatisfactory health conditions.
Calculation:
Define the random variable x as the number of restaurants with unsanitary conditions. Here, the total number of restaurants are (n) is 10 and each restaurant is independent from other restaurants. Also, there are two possible outcomes (having an unsanitary conditions or didn’t have an unsanitary conditions) and the probability of that the selected restaurant having an unsanitary conditions gives the probability (p)
The binomial distribution formula is,
Where, n is the number of trials, x is the number of successes among n trials, p is the probability of success and q is the probability of failure.
Substitute n as 10, p as 0.43, q as
Thus, the probability the person is likely to eat at all three restaurants with unsanitary conditions is 0.186.
b.
The probability that the person is likely to eat at four or five restaurants with unsanitary conditions.
Answer to Problem 1AC
The probability the person is likely to eat at four or five restaurants with unsanitary conditions is 0.469.
Explanation of Solution
Here, “Eating at four or five restaurants with unsanitary conditions gives the values of X as 4 and 5.
Substitute n as 10, p as 0.43, q as
Thus, the probability the person is likely to eat at four or five restaurants with unsanitary conditions is 0.469.
c.
To explain: The way to compute the probability of eating in at least one restaurant with unsanitary conditions.
To find: The probability of eating in at least one restaurant with unsanitary conditions.
Answer to Problem 1AC
The way to compute the probability of eating in at least one restaurant with unsanitary conditions is given below:
Eating in at least one restaurant is same as eating in 1 or more than 1 restaurants.
The probability of eating in at least one restaurant with unsanitary conditions is 0.9964.
Explanation of Solution
Calculation:
Substitute n as 10, p as 0.43, q as
=0.9964
Thus, the probability of eating in at least one restaurant is 0.9964.
d.
The most likely number that could occur in the given experiment.
Answer to Problem 1AC
The most likely number that could occur in the given experiment is the event of eating in 4 restaurants with unsanitary conditions.
Explanation of Solution
Calculation:
Software procedure:
Software procedure for calculating the probability is given below:
- Choose Calc > Probability Distributions > Binomial Distribution.
- Choose Probability.
- Enter Number of trials as 10 and Event probability as 0.43.
- In Input columns, enter the column containing the values 0, 1, 2, 3,…10.
- Click OK.
Output obtained from MINITAB is given below:
Justification:
From the MINITAB output it can be observed that the probability of eating in 4 restaurants has the highest probability of 0.2462.
The probability for 4 restaurants is the highest, but the expected number of restaurants that a person would eat is
e.
To find: The variability of the data around the most likely number.
Answer to Problem 1AC
The variability of the data around the most likely number would be 1.565 restaurants.
Explanation of Solution
Calculation:
Standard deviation:
Substitute n as 10, p as 0.43 and q as
Thus, the variability of the data around the most likely number would be 1.565 restaurants.
f.
To justify: The reason for identifying the given experiment as binomial.
Answer to Problem 1AC
The given experiment satisfies all the “requirements of binomial distribution”.
Explanation of Solution
Justification:
Requirements of binomial distribution:
- There will be a fixed number of trials.
- There are only two possible outcomes (success and failure).
- The probability of success remains constant.
- The outcomes obtained from each trial are independent of one another.
Here, the number of restaurants is 10 and it gives the fixed number of trials, there are only two possible outcomes either a restaurant might have unsanitary condition or a restaurant might not have unsanitary condition. The probability of that the selected restaurant having an unsanitary conditions gives the probability (p)
Thus, the given experiment is a binomial distribution.
g.
To check: Whether the mean of the likelihood of success is always 50%.
Answer to Problem 1AC
The mean of the likelihood of success will vary from situation to situation.
Explanation of Solution
Given info:
Use the computer generated table for checking.
Justification:
In binomial distribution the probability of success remains constant and it is 50% but it varies for situation to situation. Just having two outcomes will not assurance for equal probabilities of success.
Want to see more full solutions like this?
Chapter 5 Solutions
Connect Plus Statistics Hosted by ALEKS Access Card 52 Weeks for Elementary Statistics: A Step-By-St
Additional Math Textbook Solutions
Elementary Statistics: Picturing the World (7th Edition)
Introductory Statistics
Precalculus: A Unit Circle Approach (3rd Edition)
College Algebra (Collegiate Math)
Elementary Statistics ( 3rd International Edition ) Isbn:9781260092561
Thinking Mathematically (6th Edition)


- if the b coloumn of a z table disappeared what would be used to determine b column probabilitiesarrow_forwardConstruct a model of population flow between metropolitan and nonmetropolitan areas of a given country, given that their respective populations in 2015 were 263 million and 45 million. The probabilities are given by the following matrix. (from) (to) metro nonmetro 0.99 0.02 metro 0.01 0.98 nonmetro Predict the population distributions of metropolitan and nonmetropolitan areas for the years 2016 through 2020 (in millions, to four decimal places). (Let x, through x5 represent the years 2016 through 2020, respectively.) x₁ = x2 X3 261.27 46.73 11 259.59 48.41 11 257.96 50.04 11 256.39 51.61 11 tarrow_forwardIf the average price of a new one family home is $246,300 with a standard deviation of $15,000 find the minimum and maximum prices of the houses that a contractor will build to satisfy 88% of the market valuearrow_forward
- 21. ANALYSIS OF LAST DIGITS Heights of statistics students were obtained by the author as part of an experiment conducted for class. The last digits of those heights are listed below. Construct a frequency distribution with 10 classes. Based on the distribution, do the heights appear to be reported or actually measured? Does there appear to be a gap in the frequencies and, if so, how might that gap be explained? What do you know about the accuracy of the results? 3 4 555 0 0 0 0 0 0 0 0 0 1 1 23 3 5 5 5 5 5 5 5 5 5 5 5 5 6 6 8 8 8 9arrow_forwardA side view of a recycling bin lid is diagramed below where two panels come together at a right angle. 45 in 24 in Width? — Given this information, how wide is the recycling bin in inches?arrow_forward1 No. 2 3 4 Binomial Prob. X n P Answer 5 6 4 7 8 9 10 12345678 8 3 4 2 2552 10 0.7 0.233 0.3 0.132 7 0.6 0.290 20 0.02 0.053 150 1000 0.15 0.035 8 7 10 0.7 0.383 11 9 3 5 0.3 0.132 12 10 4 7 0.6 0.290 13 Poisson Probability 14 X lambda Answer 18 4 19 20 21 22 23 9 15 16 17 3 1234567829 3 2 0.180 2 1.5 0.251 12 10 0.095 5 3 0.101 7 4 0.060 3 2 0.180 2 1.5 0.251 24 10 12 10 0.095arrow_forward
- step by step on Microssoft on how to put this in excel and the answers please Find binomial probability if: x = 8, n = 10, p = 0.7 x= 3, n=5, p = 0.3 x = 4, n=7, p = 0.6 Quality Control: A factory produces light bulbs with a 2% defect rate. If a random sample of 20 bulbs is tested, what is the probability that exactly 2 bulbs are defective? (hint: p=2% or 0.02; x =2, n=20; use the same logic for the following problems) Marketing Campaign: A marketing company sends out 1,000 promotional emails. The probability of any email being opened is 0.15. What is the probability that exactly 150 emails will be opened? (hint: total emails or n=1000, x =150) Customer Satisfaction: A survey shows that 70% of customers are satisfied with a new product. Out of 10 randomly selected customers, what is the probability that at least 8 are satisfied? (hint: One of the keyword in this question is “at least 8”, it is not “exactly 8”, the correct formula for this should be = 1- (binom.dist(7, 10, 0.7,…arrow_forwardKate, Luke, Mary and Nancy are sharing a cake. The cake had previously been divided into four slices (s1, s2, s3 and s4). What is an example of fair division of the cake S1 S2 S3 S4 Kate $4.00 $6.00 $6.00 $4.00 Luke $5.30 $5.00 $5.25 $5.45 Mary $4.25 $4.50 $3.50 $3.75 Nancy $6.00 $4.00 $4.00 $6.00arrow_forwardFaye cuts the sandwich in two fair shares to her. What is the first half s1arrow_forward
- Question 2. An American option on a stock has payoff given by F = f(St) when it is exercised at time t. We know that the function f is convex. A person claims that because of convexity, it is optimal to exercise at expiration T. Do you agree with them?arrow_forwardQuestion 4. We consider a CRR model with So == 5 and up and down factors u = 1.03 and d = 0.96. We consider the interest rate r = 4% (over one period). Is this a suitable CRR model? (Explain your answer.)arrow_forwardQuestion 3. We want to price a put option with strike price K and expiration T. Two financial advisors estimate the parameters with two different statistical methods: they obtain the same return rate μ, the same volatility σ, but the first advisor has interest r₁ and the second advisor has interest rate r2 (r1>r2). They both use a CRR model with the same number of periods to price the option. Which advisor will get the larger price? (Explain your answer.)arrow_forward
 Big Ideas Math A Bridge To Success Algebra 1: Stu...AlgebraISBN:9781680331141Author:HOUGHTON MIFFLIN HARCOURTPublisher:Houghton Mifflin Harcourt
 Holt Mcdougal Larson Pre-algebra: Student Edition...AlgebraISBN:9780547587776Author:HOLT MCDOUGALPublisher:HOLT MCDOUGAL
 Glencoe Algebra 1, Student Edition, 9780079039897...AlgebraISBN:9780079039897Author:CarterPublisher:McGraw Hill
 Algebra & Trigonometry with Analytic GeometryAlgebraISBN:9781133382119Author:SwokowskiPublisher:Cengage
 College Algebra (MindTap Course List)AlgebraISBN:9781305652231Author:R. David Gustafson, Jeff HughesPublisher:Cengage Learning