
Concept explainers
Videos
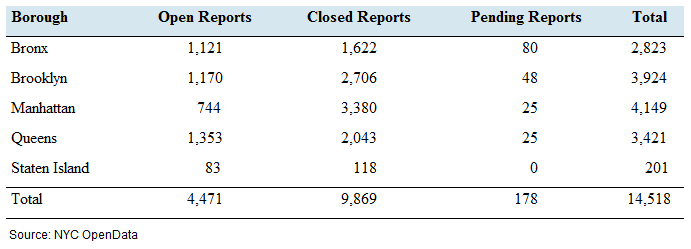
The following table presents the number of reports of graffiti each of New York’s five over a one-year period. These reports were classified as being open, closed, or pending.
A graffiti report is selected at random. Compute the following
The report is open and comes from Brooklyn.
The report is closed or comes from Queens.
The report comes from Manhattan.
The report does not come from Manhattan.
The report is pending.
The report is from the Bronx or Staten Island.
a.
To find: The probability of selected report is come from Brooklyn.
Answer to Problem 44E
The probability of selected report is come from Brooklyn is
Explanation of Solution
Given information: The data is shown below in table.
Calculation:
The number of reports comes from Brooklyn is
Therefore,
b.
To find: The probability of selected report is come from Queens.
Answer to Problem 44E
The probability of selected report is come from Queens is
Explanation of Solution
Given information: The data is shown below in table.
Calculation:
The number of reports come from Queens is
So,
c.
To find: The probability of selected report is come from Manhattan.
Answer to Problem 44E
The probability of selected report is come from Manhattan is
Explanation of Solution
Given information: The data is shown below in table.
Calculation:
The number of reports come from Manhattan is
Therefore,
d.
To find: The probability of selected report is not come from Manhattan.
Answer to Problem 44E
The probability of selected report is not come from Manhattan is
Explanation of Solution
Given information: The data is shown below in table.
Calculation:
The number of reports come from Manhattan is
It is known that,
Therefore,
e.
To find: The probability of selected report is pending.
Answer to Problem 44E
The probability of selected report is pending is
Explanation of Solution
Given information: The data is shown below in table.
Calculation:
The number of pending reports is
Therefore,
f.
To find: The probability of selected report is come from Bronx or Staten Island.
Answer to Problem 44E
The probability of selected report is come from Bronx or Staten Island is
Explanation of Solution
Given information: The data is shown below in table.
Calculation:
The number of reports come from Bronx or Staten Island is,
Hence,
Want to see more full solutions like this?
Chapter 5 Solutions
Elementary Statistics 2nd Edition


- A company found that the daily sales revenue of its flagship product follows a normal distribution with a mean of $4500 and a standard deviation of $450. The company defines a "high-sales day" that is, any day with sales exceeding $4800. please provide a step by step on how to get the answers in excel Q: What percentage of days can the company expect to have "high-sales days" or sales greater than $4800? Q: What is the sales revenue threshold for the bottom 10% of days? (please note that 10% refers to the probability/area under bell curve towards the lower tail of bell curve) Provide answers in the yellow cellsarrow_forwardFind the critical value for a left-tailed test using the F distribution with a 0.025, degrees of freedom in the numerator=12, and degrees of freedom in the denominator = 50. A portion of the table of critical values of the F-distribution is provided. Click the icon to view the partial table of critical values of the F-distribution. What is the critical value? (Round to two decimal places as needed.)arrow_forwardA retail store manager claims that the average daily sales of the store are $1,500. You aim to test whether the actual average daily sales differ significantly from this claimed value. You can provide your answer by inserting a text box and the answer must include: Null hypothesis, Alternative hypothesis, Show answer (output table/summary table), and Conclusion based on the P value. Showing the calculation is a must. If calculation is missing,so please provide a step by step on the answers Numerical answers in the yellow cellsarrow_forward
 Holt Mcdougal Larson Pre-algebra: Student Edition...AlgebraISBN:9780547587776Author:HOLT MCDOUGALPublisher:HOLT MCDOUGAL
 College Algebra (MindTap Course List)AlgebraISBN:9781305652231Author:R. David Gustafson, Jeff HughesPublisher:Cengage Learning