Concept explainers
Videos
Roulette A roulette wheel has 38 numbers, 1 through 36, 0, and 00. One-half of the numbers from 1 through 36 are red, and the other half are black; 0 and 00 are green. A ball is rolled, and it falls into one of the 38 slots, giving a number and a color. The payoffs (winnings) for a $1 bet are as follows:
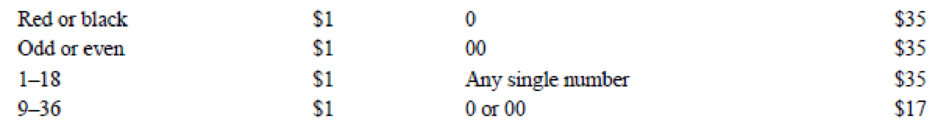
If a person bets $1, find the
a. Red
b. Even
c. 00
d. Any single number
e. 0 or 00
a.
To find: The expected value for red.
Answer to Problem 19E
The expected value for red is –5.26 cents.
Explanation of Solution
Given info:
The roulette wheel has 38 numbers, 1 through 36, 0 and 00. The red colour is from 1 through 36 is 18 and the black colour numbers is 18 and 0, 00 are green.
Calculation:
The expected value of a discrete random variable is same as the mean of that random variable.
Here, the number of red colour numbers is 18 and the total numbers is 38. So the probability of getting red colour numbers is
The probability distribution for the possible red colour numbers is calculated as follows:
| X | 1 | –1 |
|
|
|
|
The expected value is calculated as follows:
Thus, the expected value for red is –$0.0526.
Hence the expected value for red is –5.26 cents.
b.
To find: The expected value for even.
Answer to Problem 19E
The expected value for even is –5.26 cents.
Explanation of Solution
Calculation:
Here, the number of even numbers is 18 and the total numbers is 38. So the probability of getting even numbers is
The probability distribution for the possible red colour numbers is calculated as follows:
| X | 1 | –1 |
|
|
|
|
The expected value is calculated as follows:
Thus, the expected value for even is –$0.0526.
Hence the expected value for even is –5.26 cents.
c.
To find: The expected value for 00.
Answer to Problem 19E
The expected value for 00 is –5.26 cents.
Explanation of Solution
Calculation:
Here, the number of 00 numbers is 1 and the total numbers is 38. So the probability of getting 00 numbers is
The probability distribution for the possible red colour numbers is calculated as follows:
| X | 35 | –1 |
|
|
|
|
The expected value is calculated as follows:
Thus, the expected value for 00 is –$0.0526.
Hence the expected value for 00 is –5.26 cents.
d.
To find: The expected value for any single number.
Answer to Problem 19E
The expected value for any single number is –5.26 cents.
Explanation of Solution
Calculation:
Here, the number of any single numbers is 1 and the total numbers is 38. So the probability of getting any single number is
The probability distribution for the possible red colour numbers is calculated as follows:
| X | 35 | –1 |
|
|
|
|
The expected value is calculated as follows:
Thus, the expected value for any single number is –$0.0526.
Hence the expected value for any single number is –5.26 cents.
e.
To find: The expected value for 0 or 00.
Answer to Problem 19E
The expected value for 0 or 00 is –5.26 cents.
Explanation of Solution
Calculation:
Here, the number of 0 or 00 is 2 and the total numbers is 38. So the probability of getting 0 or 00 is
The probability distribution for the possible red colour numbers is calculated as follows:
| X | 17 | –1 |
|
|
|
|
The expected value is calculated as follows:
Thus, the expected value for 0 or 00 is –$0.0526.
Hence the expected value for 0 or 00 is –5.26 cents.
Want to see more full solutions like this?
Chapter 5 Solutions
Elementary Statistics: A Step By Step Approach


- Examine the Variables: Carefully review and note the names of all variables in the dataset. Examples of these variables include: Mileage (mpg) Number of Cylinders (cyl) Displacement (disp) Horsepower (hp) Research: Google to understand these variables. Statistical Analysis: Select mpg variable, and perform the following statistical tests. Once you are done with these tests using mpg variable, repeat the same with hp Mean Median First Quartile (Q1) Second Quartile (Q2) Third Quartile (Q3) Fourth Quartile (Q4) 10th Percentile 70th Percentile Skewness Kurtosis Document Your Results: In RStudio: Before running each statistical test, provide a heading in the format shown at the bottom. “# Mean of mileage – Your name’s command” In Microsoft Word: Once you've completed all tests, take a screenshot of your results in RStudio and paste it into a Microsoft Word document. Make sure that snapshots are very clear. You will need multiple snapshots. Also transfer these results to the…arrow_forwardExamine the Variables: Carefully review and note the names of all variables in the dataset. Examples of these variables include: Mileage (mpg) Number of Cylinders (cyl) Displacement (disp) Horsepower (hp) Research: Google to understand these variables. Statistical Analysis: Select mpg variable, and perform the following statistical tests. Once you are done with these tests using mpg variable, repeat the same with hp Mean Median First Quartile (Q1) Second Quartile (Q2) Third Quartile (Q3) Fourth Quartile (Q4) 10th Percentile 70th Percentile Skewness Kurtosis Document Your Results: In RStudio: Before running each statistical test, provide a heading in the format shown at the bottom. “# Mean of mileage – Your name’s command” In Microsoft Word: Once you've completed all tests, take a screenshot of your results in RStudio and paste it into a Microsoft Word document. Make sure that snapshots are very clear. You will need multiple snapshots. Also transfer these results to the…arrow_forwardExamine the Variables: Carefully review and note the names of all variables in the dataset. Examples of these variables include: Mileage (mpg) Number of Cylinders (cyl) Displacement (disp) Horsepower (hp) Research: Google to understand these variables. Statistical Analysis: Select mpg variable, and perform the following statistical tests. Once you are done with these tests using mpg variable, repeat the same with hp Mean Median First Quartile (Q1) Second Quartile (Q2) Third Quartile (Q3) Fourth Quartile (Q4) 10th Percentile 70th Percentile Skewness Kurtosis Document Your Results: In RStudio: Before running each statistical test, provide a heading in the format shown at the bottom. “# Mean of mileage – Your name’s command” In Microsoft Word: Once you've completed all tests, take a screenshot of your results in RStudio and paste it into a Microsoft Word document. Make sure that snapshots are very clear. You will need multiple snapshots. Also transfer these results to the…arrow_forward
- 2 (VaR and ES) Suppose X1 are independent. Prove that ~ Unif[-0.5, 0.5] and X2 VaRa (X1X2) < VaRa(X1) + VaRa (X2). ~ Unif[-0.5, 0.5]arrow_forward8 (Correlation and Diversification) Assume we have two stocks, A and B, show that a particular combination of the two stocks produce a risk-free portfolio when the correlation between the return of A and B is -1.arrow_forward9 (Portfolio allocation) Suppose R₁ and R2 are returns of 2 assets and with expected return and variance respectively r₁ and 72 and variance-covariance σ2, 0%½ and σ12. Find −∞ ≤ w ≤ ∞ such that the portfolio wR₁ + (1 - w) R₂ has the smallest risk.arrow_forward
- 7 (Multivariate random variable) Suppose X, €1, €2, €3 are IID N(0, 1) and Y2 Y₁ = 0.2 0.8X + €1, Y₂ = 0.3 +0.7X+ €2, Y3 = 0.2 + 0.9X + €3. = (In models like this, X is called the common factors of Y₁, Y₂, Y3.) Y = (Y1, Y2, Y3). (a) Find E(Y) and cov(Y). (b) What can you observe from cov(Y). Writearrow_forward1 (VaR and ES) Suppose X ~ f(x) with 1+x, if 0> x > −1 f(x) = 1−x if 1 x > 0 Find VaRo.05 (X) and ES0.05 (X).arrow_forwardJoy is making Christmas gifts. She has 6 1/12 feet of yarn and will need 4 1/4 to complete our project. How much yarn will she have left over compute this solution in two different ways arrow_forward
- Solve for X. Explain each step. 2^2x • 2^-4=8arrow_forwardOne hundred people were surveyed, and one question pertained to their educational background. The results of this question and their genders are given in the following table. Female (F) Male (F′) Total College degree (D) 30 20 50 No college degree (D′) 30 20 50 Total 60 40 100 If a person is selected at random from those surveyed, find the probability of each of the following events.1. The person is female or has a college degree. Answer: equation editor Equation Editor 2. The person is male or does not have a college degree. Answer: equation editor Equation Editor 3. The person is female or does not have a college degree.arrow_forwardneed help with part barrow_forward
 Glencoe Algebra 1, Student Edition, 9780079039897...AlgebraISBN:9780079039897Author:CarterPublisher:McGraw Hill
 Holt Mcdougal Larson Pre-algebra: Student Edition...AlgebraISBN:9780547587776Author:HOLT MCDOUGALPublisher:HOLT MCDOUGAL
 College Algebra (MindTap Course List)AlgebraISBN:9781305652231Author:R. David Gustafson, Jeff HughesPublisher:Cengage Learning
 Algebra & Trigonometry with Analytic GeometryAlgebraISBN:9781133382119Author:SwokowskiPublisher:Cengage
 Algebra and Trigonometry (MindTap Course List)AlgebraISBN:9781305071742Author:James Stewart, Lothar Redlin, Saleem WatsonPublisher:Cengage Learning