Production costs. The graph of the marginal cost function from the production of x thousand bottles of sunscreen per month [where cost C ( x ) is in thousands of dollars per month] is given in the figure. (A) Using the graph shown, describe the shape of the graph of the cost function C ( x ) as x increases from 0 to 8,000 bottles per month. (B) Given the equation of the marginal cost function. C ′ ( x ) = 3 x 2 − 24 x + 53 find the cost function if monthly fixed costs at 0 output are $80,000. What is the cost of manufacturing 4,000 bottles per month? 8,000 bottles per month? (C) Graph the cost function for 0 ≤ x ≤ 8 . [Check the shape of the graph relative to the analysis in part (A).]
Production costs. The graph of the marginal cost function from the production of x thousand bottles of sunscreen per month [where cost C ( x ) is in thousands of dollars per month] is given in the figure. (A) Using the graph shown, describe the shape of the graph of the cost function C ( x ) as x increases from 0 to 8,000 bottles per month. (B) Given the equation of the marginal cost function. C ′ ( x ) = 3 x 2 − 24 x + 53 find the cost function if monthly fixed costs at 0 output are $80,000. What is the cost of manufacturing 4,000 bottles per month? 8,000 bottles per month? (C) Graph the cost function for 0 ≤ x ≤ 8 . [Check the shape of the graph relative to the analysis in part (A).]
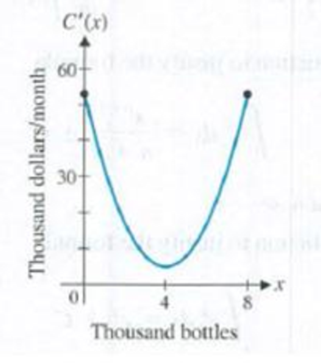
Production costs. The graph of the marginal cost function from the production of x thousand bottles of sunscreen per month [where cost C(x) is in thousands of dollars per month] is given in the figure.
(A) Using the graph shown, describe the shape of the graph of the cost function C(x) as x increases from 0 to 8,000 bottles per month.
(B) Given the equation of the marginal cost function.
C
′
(
x
)
=
3
x
2
−
24
x
+
53
find the cost function if monthly fixed costs at 0 output are $80,000. What is the cost of manufacturing 4,000 bottles per month? 8,000 bottles per month?
(C) Graph the cost function for
0
≤
x
≤
8
. [Check the shape of the graph relative to the analysis in part (A).]
The 60-lb collar A can slide on a frictionless vertical rod and is connected as shown to a 65-lb counterweight C. Draw the free-body
diagram of the collar that is needed to determine the value of h for which the system is in equilibrium.
-15 in.
A
60 lb
B
C
h
65 lb
Two cables tied together at Care loaded as shown. Given: Q = 130 lb.
30°
C
B
Determine the range of values of P for which both cables remain taut.
lb
Find the parametric equation for the line where the planes
-4x+y+3x= -11 and -2x+y=3z = 7
intersect.
Need a deep-dive on the concept behind this application? Look no further. Learn more about this topic, subject and related others by exploring similar questions and additional content below.


 Algebra and Trigonometry (MindTap Course List)AlgebraISBN:9781305071742Author:James Stewart, Lothar Redlin, Saleem WatsonPublisher:Cengage Learning
 Algebra & Trigonometry with Analytic GeometryAlgebraISBN:9781133382119Author:SwokowskiPublisher:Cengage
 Big Ideas Math A Bridge To Success Algebra 1: Stu...AlgebraISBN:9781680331141Author:HOUGHTON MIFFLIN HARCOURTPublisher:Houghton Mifflin Harcourt
 College AlgebraAlgebraISBN:9781305115545Author:James Stewart, Lothar Redlin, Saleem WatsonPublisher:Cengage Learning