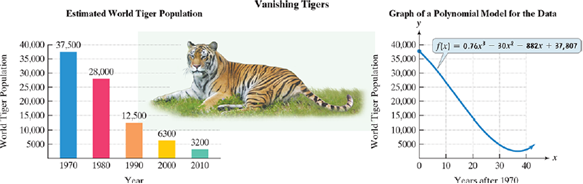
As we noted in the chapter opener, experts fear that without conservation efforts, tigers could disappear from the wild by 2022. Just one hundred years ago, there were at least 100,000 wild tigers. By 2010, the estimated world tiger population was 3200. The bar graph shows the estimated world tiger population for selected years from 1970 through 2010. Also shown is a polynomial function, with its graph, that models the data. Use this information to solve Exercises 65 –68. a. Find and interpret f ( 10 ) . Identify this information as a point on the graph of f . b. Does f ( 10 ) overestimate or underestimate the actual data shown by the bar graph? By how much?
As we noted in the chapter opener, experts fear that without conservation efforts, tigers could disappear from the wild by 2022. Just one hundred years ago, there were at least 100,000 wild tigers. By 2010, the estimated world tiger population was 3200. The bar graph shows the estimated world tiger population for selected years from 1970 through 2010. Also shown is a polynomial function, with its graph, that models the data. Use this information to solve Exercises 65 –68. a. Find and interpret f ( 10 ) . Identify this information as a point on the graph of f . b. Does f ( 10 ) overestimate or underestimate the actual data shown by the bar graph? By how much?
Solution Summary: The author analyzes the function f(x) which models theestimated world tiger population from 1970 to 2010
As we noted in the chapter opener, experts fear that without conservation efforts, tigers could disappear from the wild by 2022. Just one hundred years ago, there were at least 100,000 wild tigers. By 2010, the estimated world tiger population was 3200. The bar graph shows the estimated world tiger population for selected years from 1970 through 2010. Also shown is a polynomial function, with its graph, that models the data. Use this information to solve
Exercises 65 –68.
a. Find and interpret
f
(
10
)
.
Identify this information as a point on the graph of f.
b. Does
f
(
10
)
overestimate or underestimate the actual data shown by the bar graph? By how much?
Answer the number questions with the following answers
+/- 2 sqrt(2)
+/- i sqrt(6)
(-3 +/-3 i sqrt(3))/4
+/-1
+/- sqrt(6)
+/- 2/3 sqrt(3)
4
-3 +/- 3 i sqrt(3)
1
Matching 10 points
Factor and Solve
1)x3-216 0, x = {6,[B]}
2) 16x3 = 54 x-[3/2,[D]]
3)x4x2-42 0 x= [ +/-isqrt(7), [F] }
4)x+3-13-9x x=[+/-1.[H]]
5)x38x2+16x=0, x = {0,[K}}
6) 2x6-10x-48x2-0 x-[0, [M], +/-isqrt(3))
7) 3x+2x²-8 x = {+/-i sqrt(2), {Q}}
8) 5x³-3x²+32x=2x+18 x = {3/5, [S]}
[B]
[D]
[F]
[H]
[K]
[M]
[Q]
+/-2 sqrt(2)
+/- i sqrt(6)
(-3+/-3 i sqrt(3))/4
+/- 1
+/-sqrt(6)
+/- 2/3 sqrt(3)
4
-3 +/- 3 i sqrt(3)
[S]
The only problems I need help with ae the last 8 ones, Thanks
Chapter 5 Solutions
Intermediate Algebra for College Students (7th Edition)
Need a deep-dive on the concept behind this application? Look no further. Learn more about this topic, algebra and related others by exploring similar questions and additional content below.


 Algebra & Trigonometry with Analytic GeometryAlgebraISBN:9781133382119Author:SwokowskiPublisher:Cengage
 Big Ideas Math A Bridge To Success Algebra 1: Stu...AlgebraISBN:9781680331141Author:HOUGHTON MIFFLIN HARCOURTPublisher:Houghton Mifflin Harcourt
 Algebra: Structure And Method, Book 1AlgebraISBN:9780395977224Author:Richard G. Brown, Mary P. Dolciani, Robert H. Sorgenfrey, William L. ColePublisher:McDougal Littell
 Glencoe Algebra 1, Student Edition, 9780079039897...AlgebraISBN:9780079039897Author:CarterPublisher:McGraw Hill
 Algebra for College StudentsAlgebraISBN:9781285195780Author:Jerome E. Kaufmann, Karen L. SchwittersPublisher:Cengage Learning