
To find: The information can be obtained from the area of the region and explain.
Answer to Problem 32E
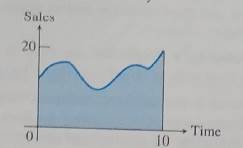
The number of units sold throughout the course of the 10-year period is then calculated as the area under the curve between 0 and 10.
Explanation of Solution
Given information:
The graph shows the sales record for a company over a 10-years periods.
The graph is:
Calculation:
Since the
The required amount of units sold, in millions, throughout the course of the 10-year period, is then represented by the area under the curve between 0 and 10.
Chapter 5 Solutions
CALCULUS:GRAPHICAL,...,AP ED.-W/ACCESS

 Calculus: Early TranscendentalsCalculusISBN:9781285741550Author:James StewartPublisher:Cengage Learning
 Thomas' Calculus (14th Edition)CalculusISBN:9780134438986Author:Joel R. Hass, Christopher E. Heil, Maurice D. WeirPublisher:PEARSON
 Calculus: Early Transcendentals (3rd Edition)CalculusISBN:9780134763644Author:William L. Briggs, Lyle Cochran, Bernard Gillett, Eric SchulzPublisher:PEARSON
 Calculus: Early TranscendentalsCalculusISBN:9781319050740Author:Jon Rogawski, Colin Adams, Robert FranzosaPublisher:W. H. Freeman
 Calculus: Early Transcendental FunctionsCalculusISBN:9781337552516Author:Ron Larson, Bruce H. EdwardsPublisher:Cengage Learning