
a)
Labeled budget line on the graph
a)
Explanation of Solution
Labeled budget line on the graph:
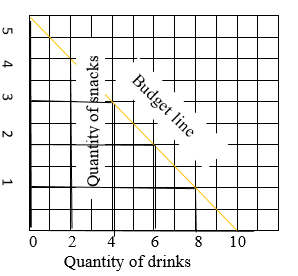
Introduction: A budget line is the graphical presentation of a price line that shows possible combination of goods that can be bought at various costs or different levels of income.
b)
b)
Explanation of Solution
| Snacks ($4) | Drinks ($2) | ||||
| Q | Total utilities | Marginal utility | Q | Total utilities | Marginal utility |
| 1 | 15 | 1 | 12 | ||
| 2 | 25 | 10 | 2 | 21 | 9 |
| 3 | 31 | 6 | 3 | 29 | 8 |
| 4 | 34 | 3 | 4 | 36 | 7 |
| 5 | 36 | 3 | 5 | 42 | 6 |
| 6 | 47 | 5 | |||
| 7 | 50 | 3 | |||
| 8 | 52 | 2 | |||
Marginal utility for fourth unit of drink is 7,
And, marginal utility per dollar is 3.5
Introduction: Marginal utility refers to the benefit or satisfaction of person by consuming one additional unit of the good.
c)
Optimal consumption rule
c)
Explanation of Solution
According to the optimal consumption rule, the marginal utility per dollar spend is the same for each product when the consumer enjoys the maximum utility by consuming or using goods or resources.
Introduction: Optimal consumption is the maximum utility that a person can gain from consuming a resource.
d)
Drinks and snacks that should be purchased to maximize the utility
d)
Explanation of Solution
To maximize the utility, 2 snacks, 6 drinks should be purchased because the total spending is $20 and by spending $8 on snacks and $12 on drinks one can enjoy the maximum utility.
Introduction: Marginal utility refers to the benefit or satisfaction of person by consuming one additional unit of the good.
Chapter 51 Solutions
Krugman's Economics For The Ap® Course

- How did Jennifer Lopez use free enterprise to become successful ?arrow_forwardAn actuary analyzes a company’s annual personal auto claims, M and annual commercialauto claims, N . The analysis reveals that V ar(M ) = 1600, V ar(N ) = 900, and thecorrelation between M and N is ρ = 0.64. Compute V ar(M + N ).arrow_forwardDon't used hand raitingarrow_forward
- Answer in step by step with explanation. Don't use Ai.arrow_forwardUse the figure below to answer the following question. Let I represent Income when healthy, let I represent income when ill. Let E [I] represent expected income for a given probability (p) of falling ill. Utility у в ULI income Is есте IM The actuarially fair & partial contract is represented by Point X × OB A Yarrow_forwardSuppose that there is a 25% chance Riju is injured and earns $180,000, and a 75% chance she stays healthy and will earn $900,000. Suppose further that her utility function is the following: U = (Income) ³. Riju's utility if she earns $180,000 is _ and her utility if she earns $900,000 is. X 56.46; 169.38 56.46; 96.55 96.55; 56.46 40.00; 200.00 169.38; 56.46arrow_forward
- Use the figure below to answer the following question. Let là represent Income when healthy, let Is represent income when ill. Let E[I], represent expected income for a given probability (p) of falling ill. Utility & B естве IH S Point D represents ☑ actuarially fair & full contract actuarially fair & partial contract O actuarially unfair & full contract uninsurance incomearrow_forwardSuppose that there is a 25% chance Riju is injured and earns $180,000, and a 75% chance she stays healthy and will earn $900,000. Suppose further that her utility function is the following: U = (Income). Riju is risk. She will prefer (given the same expected income). averse; no insurance to actuarially fair and full insurance lover; actuarially fair and full insurance to no insurance averse; actuarially fair and full insurance to no insurance neutral; he will be indifferent between actuarially fair and full insurance to no insurance lover; no insurance to actuarially fair and full insurancearrow_forward19. (20 points in total) Suppose that the market demand curve is p = 80 - 8Qd, where p is the price per unit and Qd is the number of units demanded per week, and the market supply curve is p = 5+7Qs, where Q5 is the quantity supplied per week. a. b. C. d. e. Calculate the equilibrium price and quantity for a competitive market in which there is no market failure. Draw a diagram that includes the demand and supply curves, the values of the vertical- axis intercepts, and the competitive equilibrium quantity and price. Label the curves, axes and areas. Calculate both the marginal willingness to pay and the total willingness to pay for the equilibrium quantity. Calculate both the marginal cost of the equilibrium quantity and variable cost of producing the equilibrium quantity. Calculate the total surplus. How is the value of total surplus related to your calculations in parts c and d?arrow_forward

 Principles of Economics (12th Edition)EconomicsISBN:9780134078779Author:Karl E. Case, Ray C. Fair, Sharon E. OsterPublisher:PEARSON
 Engineering Economy (17th Edition)EconomicsISBN:9780134870069Author:William G. Sullivan, Elin M. Wicks, C. Patrick KoellingPublisher:PEARSON
 Principles of Economics (MindTap Course List)EconomicsISBN:9781305585126Author:N. Gregory MankiwPublisher:Cengage Learning
 Managerial Economics: A Problem Solving ApproachEconomicsISBN:9781337106665Author:Luke M. Froeb, Brian T. McCann, Michael R. Ward, Mike ShorPublisher:Cengage Learning
 Managerial Economics & Business Strategy (Mcgraw-...EconomicsISBN:9781259290619Author:Michael Baye, Jeff PrincePublisher:McGraw-Hill Education