To Find: The graph of the linear regression equation for the given data and determine the equation that is better fit for the data.
Answer to Problem 1E
The required linear regression equation and the
Explanation of Solution
Given:
The given table is shown in Table 1
Table 1
| Time | Height |
| 0.1 | 3.04 |
| 0.2 | 5.76 |
| 0.3 | 8.16 |
| 0.4 | 10.24 |
| 0.5 | 12 |
| 0.6 | 13.44 |
| 0.7 | 14.90 |
Calculation:
Press the start button and enter the data as shown in Figure 1
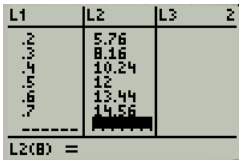
Figure 1
Press the stat button and choose CALC as shown in Figure 2
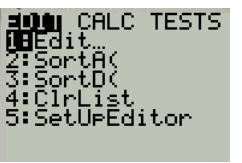
Figure 2
Press enter and select 4 as shown in Figure 3
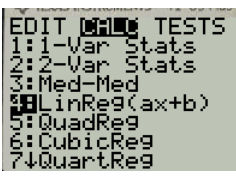
Figure 3
Press enter twice and the required linear regression is obtained as shown in Figure 4
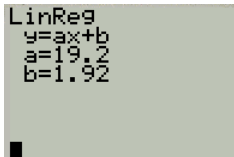
Figure 4
Press the 2nd key and then STAT PLOTS and select 1 as shown in Figure 5
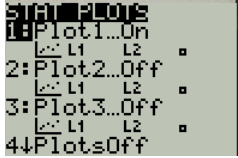
Figure 5
Press the select type and mark as shown in Figure 6

Figure 6
Press zoom button and select the option 9 as shown in Figure 7
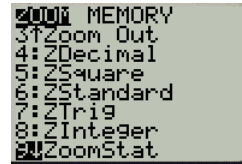
Figure 7
Press the graph button as shown in Figure 8
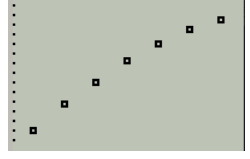
Figure 8
Press Y= button to obtain the linear regression as shown in Figure 9
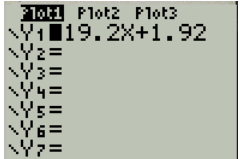
Figure 9
Then , press the graph button as shown in Figure 10
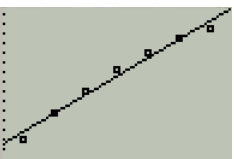
Figure 10
Press the enter and then select the option 5 as shown in Figure 11
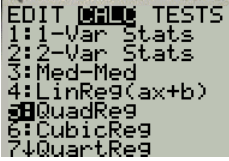
Figure 11
Press the button 2 two times and the required quadratic regression equation is obtained as shown in Figure 12
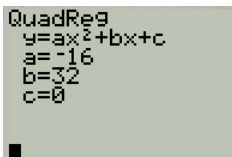
Figure 12
Press the 2nd key and then STAT PLOTS and select 1 as shown in Figure 13
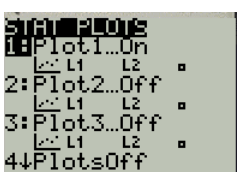
Figure 13
Press the select type and mark as shown in Figure 14

Figure 14
Press zoom button and select the option 9 as shown in Figure 15
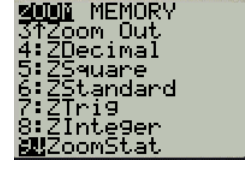
Figure 15
Press the graph button as shown in Figure 16
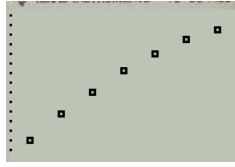
Figure 16
Press Y= button to obtain the linear regression as shown in Figure 17
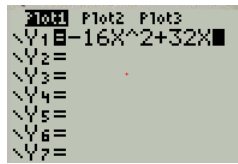
Figure 17
Then , press the graph button as shown in Figure 18
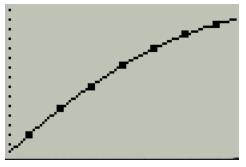
Figure 18
Thus, the required linear regression equation and the quadratic equation s are
Chapter 5 Solutions
Algebra 2
Additional Math Textbook Solutions
Basic Business Statistics, Student Value Edition
A First Course in Probability (10th Edition)
Calculus: Early Transcendentals (2nd Edition)
University Calculus: Early Transcendentals (4th Edition)
Thinking Mathematically (6th Edition)
Elementary Statistics: Picturing the World (7th Edition)

- 1. Given that h(t) = -5t + 3 t². A tangent line H to the function h(t) passes through the point (-7, B). a. Determine the value of ẞ. b. Derive an expression to represent the gradient of the tangent line H that is passing through the point (-7. B). c. Hence, derive the straight-line equation of the tangent line H 2. The function p(q) has factors of (q − 3) (2q + 5) (q) for the interval -3≤ q≤ 4. a. Derive an expression for the function p(q). b. Determine the stationary point(s) of the function p(q) c. Classify the stationary point(s) from part b. above. d. Identify the local maximum of the function p(q). e. Identify the global minimum for the function p(q). 3. Given that m(q) = -3e-24-169 +9 (-39-7)(-In (30-755 a. State all the possible rules that should be used to differentiate the function m(q). Next to the rule that has been stated, write the expression(s) of the function m(q) for which that rule will be applied. b. Determine the derivative of m(q)arrow_forwardSafari File Edit View History Bookmarks Window Help Ο Ω OV O mA 0 mW ర Fri Apr 4 1 222 tv A F9 F10 DII 4 F6 F7 F8 7 29 8 00 W E R T Y U S D பட 9 O G H J K E F11 + 11 F12 O P } [arrow_forwardSo confused. Step by step instructions pleasearrow_forward
- In simplest terms, Sketch the graph of the parabola. Then, determine its equation. opens downward, vertex is (- 4, 7), passes through point (0, - 39)arrow_forwardIn simplest way, For each quadratic relation, find the zeros and the maximum or minimum. a) y = x 2 + 16 x + 39 b) y = 5 x2 - 50 x - 120arrow_forwardIn simplest terms and step by step Write each quadratic relation in standard form, then fi nd the zeros. y = - 4( x + 6)2 + 36arrow_forward
- In simplest terms and step by step For each quadratic relation, find the zeros and the maximum or minimum. 1) y = - 2 x2 - 28 x + 64 2) y = 6 x2 + 36 x - 42arrow_forwardWrite each relation in standard form a)y = 5(x + 10)2 + 7 b)y = 9(x - 8)2 - 4arrow_forwardIn simplest form and step by step Write the quadratic relation in standard form, then fi nd the zeros. y = 3(x - 1)2 - 147arrow_forward
- Step by step instructions The path of a soccer ball can be modelled by the relation h = - 0.1 d 2 + 0.5 d + 0.6, where h is the ball’s height and d is the horizontal distance from the kicker. a) Find the zeros of the relation.arrow_forwardIn simplest terms and step by step how do you find the zeros of y = 6x2 + 24x - 192arrow_forwardStep by step Find the zeros of each quadratic relation. a) y = x2 - 16xarrow_forward
 Algebra and Trigonometry (6th Edition)AlgebraISBN:9780134463216Author:Robert F. BlitzerPublisher:PEARSON
 Contemporary Abstract AlgebraAlgebraISBN:9781305657960Author:Joseph GallianPublisher:Cengage Learning
 Linear Algebra: A Modern IntroductionAlgebraISBN:9781285463247Author:David PoolePublisher:Cengage Learning
 Algebra And Trigonometry (11th Edition)AlgebraISBN:9780135163078Author:Michael SullivanPublisher:PEARSON
 Introduction to Linear Algebra, Fifth EditionAlgebraISBN:9780980232776Author:Gilbert StrangPublisher:Wellesley-Cambridge Press
 College Algebra (Collegiate Math)AlgebraISBN:9780077836344Author:Julie Miller, Donna GerkenPublisher:McGraw-Hill Education