
Essentials of Statistics, Loose-Leaf Edition PLUS MyLab Statistics with Pearson eText -- Access Card Package (6th Edition)
6th Edition
ISBN: 9780135245729
Author: Mario F. Triola
Publisher: PEARSON
expand_more
expand_more
format_list_bulleted
Concept explainers
Videos
Textbook Question
Chapter 5.1, Problem 1BSC
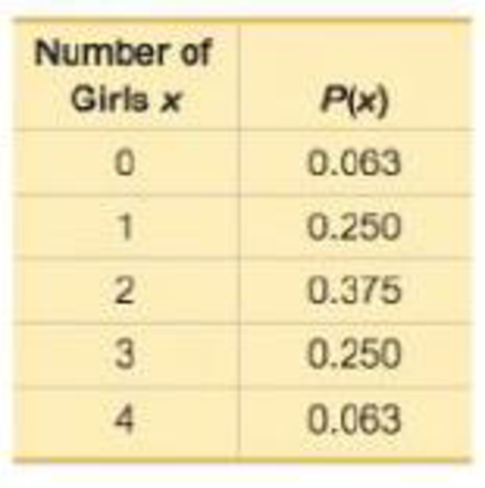
Random Variable The accompanying table lists probabilities for the corresponding numbers of girls in four births. What is the random variable, what are its possible values, and are its values numerical?
Number of Girls in Four Births
Expert Solution & Answer

Learn your wayIncludes step-by-step video

schedule01:48
Students have asked these similar questions
Analyze the residuals of a linear regression model and select the best response.
yes, the residual plot does not show a curve
no, the residual plot shows a curve
yes, the residual plot shows a curve
no, the residual plot does not show a curve
I answered, "No, the residual plot shows a curve." (and this was incorrect). I am not sure why I keep getting these wrong when the answer seems obvious. Please help me understand what the yes and no references in the answer.
a. Find the value of A.b. Find pX(x) and py(y).c. Find pX|y(x|y) and py|X(y|x)d. Are x and y independent? Why or why not?
Analyze the residuals of a linear regression model and select the best response.Criteria is simple evaluation of possible indications of an exponential model vs. linear model)
no, the residual plot does not show a curve
yes, the residual plot does not show a curve
yes, the residual plot shows a curve
no, the residual plot shows a curve
I selected:
yes, the residual plot shows a curve and it is INCORRECT. Can u help me understand why?
Chapter 5 Solutions
Essentials of Statistics, Loose-Leaf Edition PLUS MyLab Statistics with Pearson eText -- Access Card Package (6th Edition)
Ch. 5.1 - Random Variable The accompanying table lists...Ch. 5.1 - Discrete or Continuous? Is the random variable...Ch. 5.1 - Probability Distribution For the accompanying...Ch. 5.1 - Significant For 100 births, P(exactly 56 girls) =...Ch. 5.1 - Identifying Discrete and Continuous Random...Ch. 5.1 - Identifying Discrete and Continuous Random...Ch. 5.1 - Identifying Probability Distributions. In...Ch. 5.1 - Identifying Probability Distributions. In...Ch. 5.1 - Identifying Probability Distributions. In...Ch. 5.1 - Identifying Probability Distributions. In...
Ch. 5.1 - Identifying Probability Distributions. In...Ch. 5.1 - Identifying Probability Distributions. In...Ch. 5.1 - Identifying Probability Distributions. In...Ch. 5.1 - Identifying Probability Distributions. In...Ch. 5.1 - Genetics. In Exercises 1520, refer to the...Ch. 5.1 - Genetics. In Exercises 1520, refer to the...Ch. 5.1 - Genetics. In Exercises 1520, refer to the...Ch. 5.1 - Genetics. In Exercises 1520, refer to the...Ch. 5.1 - Genetics. In Exercises 1520, refer to the...Ch. 5.1 - Genetics. In Exercises 1520, refer to the...Ch. 5.1 - Sleepwalking. In Exercises 2125, refer to the...Ch. 5.1 - Sleepwalking. In Exercises 2125, refer to the...Ch. 5.1 - Sleepwalking. In Exercises 2125, refer to the...Ch. 5.1 - Sleepwalking. In Exercises 2125, refer to the...Ch. 5.1 - Sleepwalking. In Exercises 2125, refer to the...Ch. 5.1 - Expected Value for the Ohio Pick 4 Lottery In the...Ch. 5.1 - Expected Value in Virginias Pick 3 Game In...Ch. 5.1 - Expected Value in Roulette When playing roulette...Ch. 5.1 - Expected Value for Life Insurance There is a...Ch. 5.1 - Expected Value for Life Insurance There is a...Ch. 5.2 - Drone Deliveries Based on a Pitney Bowes survey,...Ch. 5.2 - Notation Assume that we want to find the...Ch. 5.2 - Independent Events Based on a Pitney Bowes survey,...Ch. 5.2 - Notation of 0 + Using the same survey from...Ch. 5.2 - Identifying Binomial Distributions. In Exercises...Ch. 5.2 - Identifying Binomial Distributions. In Exercises...Ch. 5.2 - Identifying Binomial Distributions. In Exercises...Ch. 5.2 - Identifying Binomial Distributions. In Exercises...Ch. 5.2 - Identifying Binomial Distributions. In Exercises...Ch. 5.2 - Identifying Binomial Distributions. In Exercises...Ch. 5.2 - Identifying Binomial Distributions. In Exercises...Ch. 5.2 - Identifying Binomial Distributions. In Exercises...Ch. 5.2 - Binomial Probability Formula. In Exercises 13 and...Ch. 5.2 - News Source Based on data from a Harris...Ch. 5.2 - SAT Test. In Exercises 1520, assume that random...Ch. 5.2 - SAT Test. In Exercises 1520, assume that random...Ch. 5.2 - SAT Test. In Exercises 1520, assume that random...Ch. 5.2 - SAT Test. In Exercises 1520, assume that random...Ch. 5.2 - SAT Test. In Exercises 1520, assume that random...Ch. 5.2 - SAT Test. In Exercises 1520, assume that random...Ch. 5.2 - In Exercises 2124, assume that when adults with...Ch. 5.2 - In Exercises 2124, assume that when adults with...Ch. 5.2 - In Exercises 2124, assume that when adults with...Ch. 5.2 - In Exercises 2124, assume that when adults with...Ch. 5.2 - Whitus v. Georgia In the classic legal case of...Ch. 5.2 - Vision Correction A survey sponsored by the Vision...Ch. 5.2 - See You Later Based on a Harris Interactive poll,...Ch. 5.2 - Too Young to Tat Based on a Harris poll, among...Ch. 5.2 - Significance with Range Rule of Thumb. In...Ch. 5.2 - Significance with Range Rule of Thumb. In...Ch. 5.2 - Significance with Range Rule of Thumb. In...Ch. 5.2 - Hybrids Assume that offspring peas are randomly...Ch. 5.2 - Composite Sampling. Exercises 33 and 34 involve...Ch. 5.2 - Anemia Based on data from Bloodjournal.org, 10% of...Ch. 5.2 - Acceptance Sampling. Exercises 35 and 36 involve...Ch. 5.2 - AAA Batteries AAA batteries are made by companies...Ch. 5.2 - MMs Data Set 27 MM Weights in Appendix B includes...Ch. 5.2 - Politics The County Clerk in Essex, New Jersey,...Ch. 5.2 - Perception and Reality In a presidential election,...Ch. 5.2 - Hybrids One of Mendels famous experiments with...Ch. 5.2 - Geometric Distribution If a procedure meets all...Ch. 5.2 - Multinomial Distribution The binomial distribution...Ch. 5.2 - Hypergeometric Distribution If we sample from a...Ch. 5.3 - Notation In analyzing hits by V-1 buzz bombs in...Ch. 5.3 - Tornadoes During a recent 64-year period, New...Ch. 5.3 - Poisson Probability Distribution The random...Ch. 5.3 - Probability if 0 For Formula 5-9, what does P(0)...Ch. 5.3 - Hurricanes. In Exercises 58, assume that the...Ch. 5.3 - Hurricanes a. Find the probability that in a year,...Ch. 5.3 - Hurricanes a. Find the probability that in a year,...Ch. 5.3 - Hurricanes a. Find the probability that in a year,...Ch. 5.3 - In Exercises 916, use the Poisson distribution to...Ch. 5.3 - Murders In a recent year, there were 333 murders...Ch. 5.3 - Radioactive Decay Radioactive atoms are unstable...Ch. 5.3 - Deaths from Horse Kicks A classical example of the...Ch. 5.3 - World War II Bombs In Exercise 1Notation we noted...Ch. 5.3 - Disease Cluster Neuroblastoma, a rare form of...Ch. 5.3 - Car Fatalities The recent rate of car fatalities...Ch. 5.3 - Checks In a recent year, the author wrote 181...Ch. 5.3 - Powerball: Poisson Approximation to Binomial There...Ch. 5 - Is a probability distribution defined if the only...Ch. 5 - There are 80 questions from an SAT test, and they...Ch. 5 - Are the values Found in Exercise 2 statistics or...Ch. 5 - Using the same SAT questions described in Exercise...Ch. 5 - Using the same SAT questions described in Exercise...Ch. 5 - In Exercises 610, use the following: Five American...Ch. 5 - In Exercises 610, use the following: Five American...Ch. 5 - Based on the table, the standard deviation is 0.9...Ch. 5 - 9. What does the probability of 0+ indicate? Does...Ch. 5 - In Exercises 6-10, use the following: Five...Ch. 5 - In Exercises 15, assume that 74% of randomly...Ch. 5 - In Exercises 15, assume that 74% of randomly...Ch. 5 - In Exercises 15, assume that 74% of randomly...Ch. 5 - In Exercises 15, assume that 74% of randomly...Ch. 5 - In Exercises 15, assume that 74% of randomly...Ch. 5 - Security Survey In a USA Today poll, subjects were...Ch. 5 - Brand Recognition In a study of brand recognition...Ch. 5 - Family/Partner Groups of people aged 1565 are...Ch. 5 - Detecting Fraud The Brooklyn District Attorneys...Ch. 5 - Poisson: Deaths Currently, an average of 7...Ch. 5 - Planets The planets of the solar system have the...Ch. 5 - South Carolina Pick 3 In South Carolinas Pick 3...Ch. 5 - Tennis Challenge In a recent U.S. Open tennis...Ch. 5 - Job Applicants The Society for Human Resource...Ch. 5 - Bar Graph Fox News broadcast a graph similar to...Ch. 5 - Washing Hands Based on results from a Bradley...Ch. 5 - Overbooking Flights American Airlines Flight 171...Ch. 5 - Critical Thinking: Did Mendels results from plant...
Additional Math Textbook Solutions
Find more solutions based on key concepts
8. Effect of Blinding Among 13,200 submitted abstracts that were blindly evaluated (with authors and institutio...
Elementary Statistics
Matching In Exercises 17–20, match the level of confidence c with the appropriate confidence interval. Assume e...
Elementary Statistics: Picturing the World (7th Edition)
Choose your test Use the test of your choice to determine whether the following series converge. 49. k=31lnk
Calculus: Early Transcendentals (2nd Edition)
Whether 22 is prime or composite number.
Pre-Algebra Student Edition
Fill in each blanks so that the resulting statement is true. Any set of ordered pairs is called a/an _______. T...
College Algebra (7th Edition)
Knowledge Booster


Learn more about
Need a deep-dive on the concept behind this application? Look no further. Learn more about this topic, statistics and related others by exploring similar questions and additional content below.Similar questions
- You have been hired as an intern to run analyses on the data and report the results back to Sarah; the five questions that Sarah needs you to address are given below. please do it step by step on excel Does there appear to be a positive or negative relationship between price and screen size? Use a scatter plot to examine the relationship. Determine and interpret the correlation coefficient between the two variables. In your interpretation, discuss the direction of the relationship (positive, negative, or zero relationship). Also discuss the strength of the relationship. Estimate the relationship between screen size and price using a simple linear regression model and interpret the estimated coefficients. (In your interpretation, tell the dollar amount by which price will change for each unit of increase in screen size). Include the manufacturer dummy variable (Samsung=1, 0 otherwise) and estimate the relationship between screen size, price and manufacturer dummy as a multiple…arrow_forwardHere is data with as the response variable. x y54.4 19.124.9 99.334.5 9.476.6 0.359.4 4.554.4 0.139.2 56.354 15.773.8 9-156.1 319.2Make a scatter plot of this data. Which point is an outlier? Enter as an ordered pair, e.g., (x,y). (x,y)= Find the regression equation for the data set without the outlier. Enter the equation of the form mx+b rounded to three decimal places. y_wo= Find the regression equation for the data set with the outlier. Enter the equation of the form mx+b rounded to three decimal places. y_w=arrow_forwardYou have been hired as an intern to run analyses on the data and report the results back to Sarah; the five questions that Sarah needs you to address are given below. please do it step by step Does there appear to be a positive or negative relationship between price and screen size? Use a scatter plot to examine the relationship. Determine and interpret the correlation coefficient between the two variables. In your interpretation, discuss the direction of the relationship (positive, negative, or zero relationship). Also discuss the strength of the relationship. Estimate the relationship between screen size and price using a simple linear regression model and interpret the estimated coefficients. (In your interpretation, tell the dollar amount by which price will change for each unit of increase in screen size). Include the manufacturer dummy variable (Samsung=1, 0 otherwise) and estimate the relationship between screen size, price and manufacturer dummy as a multiple linear…arrow_forward
- Exercises: Find all the whole number solutions of the congruence equation. 1. 3x 8 mod 11 2. 2x+3= 8 mod 12 3. 3x+12= 7 mod 10 4. 4x+6= 5 mod 8 5. 5x+3= 8 mod 12arrow_forwardScenario Sales of products by color follow a peculiar, but predictable, pattern that determines how many units will sell in any given year. This pattern is shown below Product Color 1995 1996 1997 Red 28 42 21 1998 23 1999 29 2000 2001 2002 Unit Sales 2003 2004 15 8 4 2 1 2005 2006 discontinued Green 26 39 20 22 28 14 7 4 2 White 43 65 33 36 45 23 12 Brown 58 87 44 48 60 Yellow 37 56 28 31 Black 28 42 21 Orange 19 29 Purple Total 28 42 21 49 68 78 95 123 176 181 164 127 24 179 Questions A) Which color will sell the most units in 2007? B) Which color will sell the most units combined in the 2007 to 2009 period? Please show all your analysis, leave formulas in cells, and specify any assumptions you make.arrow_forwardOne hundred students were surveyed about their preference between dogs and cats. The following two-way table displays data for the sample of students who responded to the survey. Preference Male Female TOTAL Prefers dogs \[36\] \[20\] \[56\] Prefers cats \[10\] \[26\] \[36\] No preference \[2\] \[6\] \[8\] TOTAL \[48\] \[52\] \[100\] problem 1 Find the probability that a randomly selected student prefers dogs.Enter your answer as a fraction or decimal. \[P\left(\text{prefers dogs}\right)=\] Incorrect Check Hide explanation Preference Male Female TOTAL Prefers dogs \[\blueD{36}\] \[\blueD{20}\] \[\blueE{56}\] Prefers cats \[10\] \[26\] \[36\] No preference \[2\] \[6\] \[8\] TOTAL \[48\] \[52\] \[100\] There were \[\blueE{56}\] students in the sample who preferred dogs out of \[100\] total students.arrow_forward
- Business discussarrow_forwardYou have been hired as an intern to run analyses on the data and report the results back to Sarah; the five questions that Sarah needs you to address are given below. Does there appear to be a positive or negative relationship between price and screen size? Use a scatter plot to examine the relationship. Determine and interpret the correlation coefficient between the two variables. In your interpretation, discuss the direction of the relationship (positive, negative, or zero relationship). Also discuss the strength of the relationship. Estimate the relationship between screen size and price using a simple linear regression model and interpret the estimated coefficients. (In your interpretation, tell the dollar amount by which price will change for each unit of increase in screen size). Include the manufacturer dummy variable (Samsung=1, 0 otherwise) and estimate the relationship between screen size, price and manufacturer dummy as a multiple linear regression model. Interpret the…arrow_forwardDoes there appear to be a positive or negative relationship between price and screen size? Use a scatter plot to examine the relationship. How to take snapshots: if you use a MacBook, press Command+ Shift+4 to take snapshots. If you are using Windows, use the Snipping Tool to take snapshots. Question 1: Determine and interpret the correlation coefficient between the two variables. In your interpretation, discuss the direction of the relationship (positive, negative, or zero relationship). Also discuss the strength of the relationship. Value of correlation coefficient: Direction of the relationship (positive, negative, or zero relationship): Strength of the relationship (strong/moderate/weak): Question 2: Estimate the relationship between screen size and price using a simple linear regression model and interpret the estimated coefficients. In your interpretation, tell the dollar amount by which price will change for each unit of increase in screen size. (The answer for the…arrow_forward
- In this problem, we consider a Brownian motion (W+) t≥0. We consider a stock model (St)t>0 given (under the measure P) by d.St 0.03 St dt + 0.2 St dwt, with So 2. We assume that the interest rate is r = 0.06. The purpose of this problem is to price an option on this stock (which we name cubic put). This option is European-type, with maturity 3 months (i.e. T = 0.25 years), and payoff given by F = (8-5)+ (a) Write the Stochastic Differential Equation satisfied by (St) under the risk-neutral measure Q. (You don't need to prove it, simply give the answer.) (b) Give the price of a regular European put on (St) with maturity 3 months and strike K = 2. (c) Let X = S. Find the Stochastic Differential Equation satisfied by the process (Xt) under the measure Q. (d) Find an explicit expression for X₁ = S3 under measure Q. (e) Using the results above, find the price of the cubic put option mentioned above. (f) Is the price in (e) the same as in question (b)? (Explain why.)arrow_forwardProblem 4. Margrabe formula and the Greeks (20 pts) In the homework, we determined the Margrabe formula for the price of an option allowing you to swap an x-stock for a y-stock at time T. For stocks with initial values xo, yo, common volatility σ and correlation p, the formula was given by Fo=yo (d+)-x0Þ(d_), where In (±² Ꭲ d+ õ√T and σ = σ√√√2(1 - p). дго (a) We want to determine a "Greek" for ỡ on the option: find a formula for θα (b) Is дго θα positive or negative? (c) We consider a situation in which the correlation p between the two stocks increases: what can you say about the price Fo? (d) Assume that yo< xo and p = 1. What is the price of the option?arrow_forwardWe consider a 4-dimensional stock price model given (under P) by dẴ₁ = µ· Xt dt + йt · ΣdŴt where (W) is an n-dimensional Brownian motion, π = (0.02, 0.01, -0.02, 0.05), 0.2 0 0 0 0.3 0.4 0 0 Σ= -0.1 -4a За 0 0.2 0.4 -0.1 0.2) and a E R. We assume that ☑0 = (1, 1, 1, 1) and that the interest rate on the market is r = 0.02. (a) Give a condition on a that would make stock #3 be the one with largest volatility. (b) Find the diversification coefficient for this portfolio as a function of a. (c) Determine the maximum diversification coefficient d that you could reach by varying the value of a? 2arrow_forward
arrow_back_ios
SEE MORE QUESTIONS
arrow_forward_ios
Recommended textbooks for you

 Holt Mcdougal Larson Pre-algebra: Student Edition...AlgebraISBN:9780547587776Author:HOLT MCDOUGALPublisher:HOLT MCDOUGAL
 Algebra and Trigonometry (MindTap Course List)AlgebraISBN:9781305071742Author:James Stewart, Lothar Redlin, Saleem WatsonPublisher:Cengage Learning
 College AlgebraAlgebraISBN:9781305115545Author:James Stewart, Lothar Redlin, Saleem WatsonPublisher:Cengage Learning
 College Algebra (MindTap Course List)AlgebraISBN:9781305652231Author:R. David Gustafson, Jeff HughesPublisher:Cengage Learning
Holt Mcdougal Larson Pre-algebra: Student Edition...
Algebra
ISBN:9780547587776
Author:HOLT MCDOUGAL
Publisher:HOLT MCDOUGAL
Algebra and Trigonometry (MindTap Course List)
Algebra
ISBN:9781305071742
Author:James Stewart, Lothar Redlin, Saleem Watson
Publisher:Cengage Learning
College Algebra
Algebra
ISBN:9781305115545
Author:James Stewart, Lothar Redlin, Saleem Watson
Publisher:Cengage Learning
College Algebra (MindTap Course List)
Algebra
ISBN:9781305652231
Author:R. David Gustafson, Jeff Hughes
Publisher:Cengage Learning
Mod-01 Lec-01 Discrete probability distributions (Part 1); Author: nptelhrd;https://www.youtube.com/watch?v=6x1pL9Yov1k;License: Standard YouTube License, CC-BY
Discrete Probability Distributions; Author: Learn Something;https://www.youtube.com/watch?v=m9U4UelWLFs;License: Standard YouTube License, CC-BY
Probability Distribution Functions (PMF, PDF, CDF); Author: zedstatistics;https://www.youtube.com/watch?v=YXLVjCKVP7U;License: Standard YouTube License, CC-BY
Discrete Distributions: Binomial, Poisson and Hypergeometric | Statistics for Data Science; Author: Dr. Bharatendra Rai;https://www.youtube.com/watch?v=lHhyy4JMigg;License: Standard Youtube License