
Essentials of Statistics, Loose-Leaf Edition PLUS MyLab Statistics with Pearson eText -- Access Card Package (6th Edition)
6th Edition
ISBN: 9780135245729
Author: Mario F. Triola
Publisher: PEARSON
expand_more
expand_more
format_list_bulleted
Concept explainers
Videos
Textbook Question
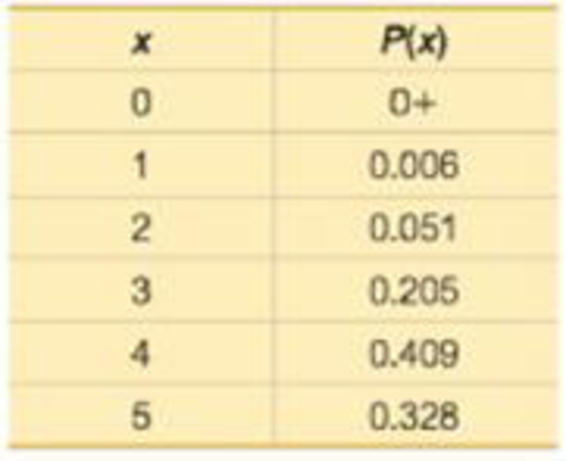
Chapter 5, Problem 8CQQ
Based on the table, the standard deviation is 0.9 flight. What is the variance? Include appropriate units.
Expert Solution & Answer
Want to see the full answer?
Check out a sample textbook solution
Students have asked these similar questions
3. Bayesian Inference – Updating Beliefs
A medical test for a rare disease has the following characteristics:
Sensitivity (true positive rate): 99%
Specificity (true negative rate): 98%
The disease occurs in 0.5% of the population.
A patient receives a positive test result.
Questions:
a) Define the relevant events and use Bayes’ Theorem to compute the probability that the patient actually has the disease.b) Explain why the result might seem counterintuitive, despite the high sensitivity and specificity.c) Discuss how prior probabilities influence posterior beliefs in Bayesian inference.d) Suppose a second, independent test with the same accuracy is conducted and is also positive. Update the probability that the patient has the disease.
4. Linear Regression - Model Assumptions and Interpretation
A real estate analyst is studying how house prices (Y) are related to house size in square feet (X). A simple
linear regression model is proposed:
The analyst fits the model and obtains:
•
Ŷ50,000+150X
YBoB₁X + €
•
R² = 0.76
• Residuals show a fan-shaped pattern when plotted against fitted values.
Questions:
a) Interpret the slope coefficient in context.
b) Explain what the R² value tells us about the model's performance.
c) Based on the residual pattern, what regression assumption is likely violated? What might be the
consequence?
d) Suggest at least two remedies to improve the model, based on the residual analysis.
5. Probability Distributions – Continuous Random Variables
A factory machine produces metal rods whose lengths (in cm) follow a continuous uniform distribution on the interval [98, 102].
Questions:
a) Define the probability density function (PDF) of the rod length.b) Calculate the probability that a randomly selected rod is shorter than 99 cm.c) Determine the expected value and variance of rod lengths.d) If a sample of 25 rods is selected, what is the probability that their average length is between 99.5 cm and 100.5 cm? Justify your answer using the appropriate distribution.
Chapter 5 Solutions
Essentials of Statistics, Loose-Leaf Edition PLUS MyLab Statistics with Pearson eText -- Access Card Package (6th Edition)
Ch. 5.1 - Random Variable The accompanying table lists...Ch. 5.1 - Discrete or Continuous? Is the random variable...Ch. 5.1 - Probability Distribution For the accompanying...Ch. 5.1 - Significant For 100 births, P(exactly 56 girls) =...Ch. 5.1 - Identifying Discrete and Continuous Random...Ch. 5.1 - Identifying Discrete and Continuous Random...Ch. 5.1 - Identifying Probability Distributions. In...Ch. 5.1 - Identifying Probability Distributions. In...Ch. 5.1 - Identifying Probability Distributions. In...Ch. 5.1 - Identifying Probability Distributions. In...
Ch. 5.1 - Identifying Probability Distributions. In...Ch. 5.1 - Identifying Probability Distributions. In...Ch. 5.1 - Identifying Probability Distributions. In...Ch. 5.1 - Identifying Probability Distributions. In...Ch. 5.1 - Genetics. In Exercises 1520, refer to the...Ch. 5.1 - Genetics. In Exercises 1520, refer to the...Ch. 5.1 - Genetics. In Exercises 1520, refer to the...Ch. 5.1 - Genetics. In Exercises 1520, refer to the...Ch. 5.1 - Genetics. In Exercises 1520, refer to the...Ch. 5.1 - Genetics. In Exercises 1520, refer to the...Ch. 5.1 - Sleepwalking. In Exercises 2125, refer to the...Ch. 5.1 - Sleepwalking. In Exercises 2125, refer to the...Ch. 5.1 - Sleepwalking. In Exercises 2125, refer to the...Ch. 5.1 - Sleepwalking. In Exercises 2125, refer to the...Ch. 5.1 - Sleepwalking. In Exercises 2125, refer to the...Ch. 5.1 - Expected Value for the Ohio Pick 4 Lottery In the...Ch. 5.1 - Expected Value in Virginias Pick 3 Game In...Ch. 5.1 - Expected Value in Roulette When playing roulette...Ch. 5.1 - Expected Value for Life Insurance There is a...Ch. 5.1 - Expected Value for Life Insurance There is a...Ch. 5.2 - Drone Deliveries Based on a Pitney Bowes survey,...Ch. 5.2 - Notation Assume that we want to find the...Ch. 5.2 - Independent Events Based on a Pitney Bowes survey,...Ch. 5.2 - Notation of 0 + Using the same survey from...Ch. 5.2 - Identifying Binomial Distributions. In Exercises...Ch. 5.2 - Identifying Binomial Distributions. In Exercises...Ch. 5.2 - Identifying Binomial Distributions. In Exercises...Ch. 5.2 - Identifying Binomial Distributions. In Exercises...Ch. 5.2 - Identifying Binomial Distributions. In Exercises...Ch. 5.2 - Identifying Binomial Distributions. In Exercises...Ch. 5.2 - Identifying Binomial Distributions. In Exercises...Ch. 5.2 - Identifying Binomial Distributions. In Exercises...Ch. 5.2 - Binomial Probability Formula. In Exercises 13 and...Ch. 5.2 - News Source Based on data from a Harris...Ch. 5.2 - SAT Test. In Exercises 1520, assume that random...Ch. 5.2 - SAT Test. In Exercises 1520, assume that random...Ch. 5.2 - SAT Test. In Exercises 1520, assume that random...Ch. 5.2 - SAT Test. In Exercises 1520, assume that random...Ch. 5.2 - SAT Test. In Exercises 1520, assume that random...Ch. 5.2 - SAT Test. In Exercises 1520, assume that random...Ch. 5.2 - In Exercises 2124, assume that when adults with...Ch. 5.2 - In Exercises 2124, assume that when adults with...Ch. 5.2 - In Exercises 2124, assume that when adults with...Ch. 5.2 - In Exercises 2124, assume that when adults with...Ch. 5.2 - Whitus v. Georgia In the classic legal case of...Ch. 5.2 - Vision Correction A survey sponsored by the Vision...Ch. 5.2 - See You Later Based on a Harris Interactive poll,...Ch. 5.2 - Too Young to Tat Based on a Harris poll, among...Ch. 5.2 - Significance with Range Rule of Thumb. In...Ch. 5.2 - Significance with Range Rule of Thumb. In...Ch. 5.2 - Significance with Range Rule of Thumb. In...Ch. 5.2 - Hybrids Assume that offspring peas are randomly...Ch. 5.2 - Composite Sampling. Exercises 33 and 34 involve...Ch. 5.2 - Anemia Based on data from Bloodjournal.org, 10% of...Ch. 5.2 - Acceptance Sampling. Exercises 35 and 36 involve...Ch. 5.2 - AAA Batteries AAA batteries are made by companies...Ch. 5.2 - MMs Data Set 27 MM Weights in Appendix B includes...Ch. 5.2 - Politics The County Clerk in Essex, New Jersey,...Ch. 5.2 - Perception and Reality In a presidential election,...Ch. 5.2 - Hybrids One of Mendels famous experiments with...Ch. 5.2 - Geometric Distribution If a procedure meets all...Ch. 5.2 - Multinomial Distribution The binomial distribution...Ch. 5.2 - Hypergeometric Distribution If we sample from a...Ch. 5.3 - Notation In analyzing hits by V-1 buzz bombs in...Ch. 5.3 - Tornadoes During a recent 64-year period, New...Ch. 5.3 - Poisson Probability Distribution The random...Ch. 5.3 - Probability if 0 For Formula 5-9, what does P(0)...Ch. 5.3 - Hurricanes. In Exercises 58, assume that the...Ch. 5.3 - Hurricanes a. Find the probability that in a year,...Ch. 5.3 - Hurricanes a. Find the probability that in a year,...Ch. 5.3 - Hurricanes a. Find the probability that in a year,...Ch. 5.3 - In Exercises 916, use the Poisson distribution to...Ch. 5.3 - Murders In a recent year, there were 333 murders...Ch. 5.3 - Radioactive Decay Radioactive atoms are unstable...Ch. 5.3 - Deaths from Horse Kicks A classical example of the...Ch. 5.3 - World War II Bombs In Exercise 1Notation we noted...Ch. 5.3 - Disease Cluster Neuroblastoma, a rare form of...Ch. 5.3 - Car Fatalities The recent rate of car fatalities...Ch. 5.3 - Checks In a recent year, the author wrote 181...Ch. 5.3 - Powerball: Poisson Approximation to Binomial There...Ch. 5 - Is a probability distribution defined if the only...Ch. 5 - There are 80 questions from an SAT test, and they...Ch. 5 - Are the values Found in Exercise 2 statistics or...Ch. 5 - Using the same SAT questions described in Exercise...Ch. 5 - Using the same SAT questions described in Exercise...Ch. 5 - In Exercises 610, use the following: Five American...Ch. 5 - In Exercises 610, use the following: Five American...Ch. 5 - Based on the table, the standard deviation is 0.9...Ch. 5 - 9. What does the probability of 0+ indicate? Does...Ch. 5 - In Exercises 6-10, use the following: Five...Ch. 5 - In Exercises 15, assume that 74% of randomly...Ch. 5 - In Exercises 15, assume that 74% of randomly...Ch. 5 - In Exercises 15, assume that 74% of randomly...Ch. 5 - In Exercises 15, assume that 74% of randomly...Ch. 5 - In Exercises 15, assume that 74% of randomly...Ch. 5 - Security Survey In a USA Today poll, subjects were...Ch. 5 - Brand Recognition In a study of brand recognition...Ch. 5 - Family/Partner Groups of people aged 1565 are...Ch. 5 - Detecting Fraud The Brooklyn District Attorneys...Ch. 5 - Poisson: Deaths Currently, an average of 7...Ch. 5 - Planets The planets of the solar system have the...Ch. 5 - South Carolina Pick 3 In South Carolinas Pick 3...Ch. 5 - Tennis Challenge In a recent U.S. Open tennis...Ch. 5 - Job Applicants The Society for Human Resource...Ch. 5 - Bar Graph Fox News broadcast a graph similar to...Ch. 5 - Washing Hands Based on results from a Bradley...Ch. 5 - Overbooking Flights American Airlines Flight 171...Ch. 5 - Critical Thinking: Did Mendels results from plant...
Knowledge Booster


Learn more about
Need a deep-dive on the concept behind this application? Look no further. Learn more about this topic, statistics and related others by exploring similar questions and additional content below.Similar questions
- 2. Hypothesis Testing - Two Sample Means A nutritionist is investigating the effect of two different diet programs, A and B, on weight loss. Two independent samples of adults were randomly assigned to each diet for 12 weeks. The weight losses (in kg) are normally distributed. Sample A: n = 35, 4.8, s = 1.2 Sample B: n=40, 4.3, 8 = 1.0 Questions: a) State the null and alternative hypotheses to test whether there is a significant difference in mean weight loss between the two diet programs. b) Perform a hypothesis test at the 5% significance level and interpret the result. c) Compute a 95% confidence interval for the difference in means and interpret it. d) Discuss assumptions of this test and explain how violations of these assumptions could impact the results.arrow_forward1. Sampling Distribution and the Central Limit Theorem A company produces batteries with a mean lifetime of 300 hours and a standard deviation of 50 hours. The lifetimes are not normally distributed—they are right-skewed due to some batteries lasting unusually long. Suppose a quality control analyst selects a random sample of 64 batteries from a large production batch. Questions: a) Explain whether the distribution of sample means will be approximately normal. Justify your answer using the Central Limit Theorem. b) Compute the mean and standard deviation of the sampling distribution of the sample mean. c) What is the probability that the sample mean lifetime of the 64 batteries exceeds 310 hours? d) Discuss how the sample size affects the shape and variability of the sampling distribution.arrow_forwardA biologist is investigating the effect of potential plant hormones by treating 20 stem segments. At the end of the observation period he computes the following length averages: Compound X = 1.18 Compound Y = 1.17 Based on these mean values he concludes that there are no treatment differences. 1) Are you satisfied with his conclusion? Why or why not? 2) If he asked you for help in analyzing these data, what statistical method would you suggest that he use to come to a meaningful conclusion about his data and why? 3) Are there any other questions you would ask him regarding his experiment, data collection, and analysis methods?arrow_forward
- Businessarrow_forwardWhat is the solution and answer to question?arrow_forwardTo: [Boss's Name] From: Nathaniel D Sain Date: 4/5/2025 Subject: Decision Analysis for Business Scenario Introduction to the Business Scenario Our delivery services business has been experiencing steady growth, leading to an increased demand for faster and more efficient deliveries. To meet this demand, we must decide on the best strategy to expand our fleet. The three possible alternatives under consideration are purchasing new delivery vehicles, leasing vehicles, or partnering with third-party drivers. The decision must account for various external factors, including fuel price fluctuations, demand stability, and competition growth, which we categorize as the states of nature. Each alternative presents unique advantages and challenges, and our goal is to select the most viable option using a structured decision-making approach. Alternatives and States of Nature The three alternatives for fleet expansion were chosen based on their cost implications, operational efficiency, and…arrow_forward
- The following ordered data list shows the data speeds for cell phones used by a telephone company at an airport: A. Calculate the Measures of Central Tendency from the ungrouped data list. B. Group the data in an appropriate frequency table. C. Calculate the Measures of Central Tendency using the table in point B. 0.8 1.4 1.8 1.9 3.2 3.6 4.5 4.5 4.6 6.2 6.5 7.7 7.9 9.9 10.2 10.3 10.9 11.1 11.1 11.6 11.8 12.0 13.1 13.5 13.7 14.1 14.2 14.7 15.0 15.1 15.5 15.8 16.0 17.5 18.2 20.2 21.1 21.5 22.2 22.4 23.1 24.5 25.7 28.5 34.6 38.5 43.0 55.6 71.3 77.8arrow_forwardII Consider the following data matrix X: X1 X2 0.5 0.4 0.2 0.5 0.5 0.5 10.3 10 10.1 10.4 10.1 10.5 What will the resulting clusters be when using the k-Means method with k = 2. In your own words, explain why this result is indeed expected, i.e. why this clustering minimises the ESS map.arrow_forwardwhy the answer is 3 and 10?arrow_forward
arrow_back_ios
SEE MORE QUESTIONS
arrow_forward_ios
Recommended textbooks for you
 Big Ideas Math A Bridge To Success Algebra 1: Stu...AlgebraISBN:9781680331141Author:HOUGHTON MIFFLIN HARCOURTPublisher:Houghton Mifflin Harcourt
 Glencoe Algebra 1, Student Edition, 9780079039897...AlgebraISBN:9780079039897Author:CarterPublisher:McGraw Hill
 Holt Mcdougal Larson Pre-algebra: Student Edition...AlgebraISBN:9780547587776Author:HOLT MCDOUGALPublisher:HOLT MCDOUGAL
Big Ideas Math A Bridge To Success Algebra 1: Stu...
Algebra
ISBN:9781680331141
Author:HOUGHTON MIFFLIN HARCOURT
Publisher:Houghton Mifflin Harcourt
Glencoe Algebra 1, Student Edition, 9780079039897...
Algebra
ISBN:9780079039897
Author:Carter
Publisher:McGraw Hill
Holt Mcdougal Larson Pre-algebra: Student Edition...
Algebra
ISBN:9780547587776
Author:HOLT MCDOUGAL
Publisher:HOLT MCDOUGAL
The Shape of Data: Distributions: Crash Course Statistics #7; Author: CrashCourse;https://www.youtube.com/watch?v=bPFNxD3Yg6U;License: Standard YouTube License, CC-BY
Shape, Center, and Spread - Module 20.2 (Part 1); Author: Mrmathblog;https://www.youtube.com/watch?v=COaid7O_Gag;License: Standard YouTube License, CC-BY
Shape, Center and Spread; Author: Emily Murdock;https://www.youtube.com/watch?v=_YyW0DSCzpM;License: Standard Youtube License