
Elementary Statistics (13th Edition)
13th Edition
ISBN: 9780134462455
Author: Mario F. Triola
Publisher: PEARSON
expand_more
expand_more
format_list_bulleted
Concept explainers
Videos
Textbook Question
Chapter 5.1, Problem 1BSC
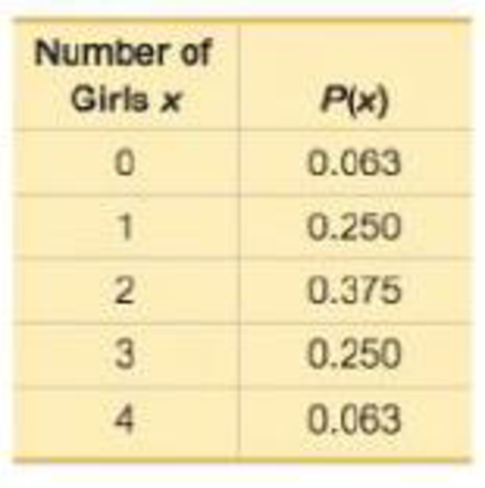
Random Variable The accompanying table lists probabilities for the corresponding numbers of girls in four births. What is the random variable, what are its possible values, and are its values numerical?
Number of Girls in Four Births
Expert Solution & Answer

Learn your wayIncludes step-by-step video

schedule01:48
Students have asked these similar questions
(c) Because logistic regression predicts probabilities of outcomes, observations used to build a logistic regression model need not be independent.
A. false: all observations must be independent
B. true
C. false: only observations with the same outcome need to be independent
I ANSWERED: A. false: all observations must be independent.
(This was marked wrong but I have no idea why. Isn't this a basic assumption of logistic regression)
Business discuss
Spam filters are built on principles similar to those used in logistic regression. We fit a probability that each message is spam or not spam. We have several variables for each email. Here are a few: to_multiple=1 if there are multiple recipients, winner=1 if the word 'winner' appears in the subject line, format=1 if the email is poorly formatted, re_subj=1 if "re" appears in the subject line. A logistic model was fit to a dataset with the following output:
Estimate
SE
Z
Pr(>|Z|)
(Intercept)
-0.8161
0.086
-9.4895
0
to_multiple
-2.5651
0.3052
-8.4047
0
winner
1.5801
0.3156
5.0067
0
format
-0.1528
0.1136
-1.3451
0.1786
re_subj
-2.8401
0.363
-7.824
0
(a) Write down the model using the coefficients from the model fit.log_odds(spam) = -0.8161 + -2.5651 + to_multiple + 1.5801 winner + -0.1528 format + -2.8401 re_subj(b) Suppose we have an observation where to_multiple=0, winner=1, format=0, and re_subj=0. What is the predicted probability that this message is spam?…
Chapter 5 Solutions
Elementary Statistics (13th Edition)
Ch. 5.1 - Random Variable The accompanying table lists...Ch. 5.1 - Discrete or Continuous? Is the random variable...Ch. 5.1 - Probability Distribution For the accompanying...Ch. 5.1 - Significant For 100 births, P(exactly 56 girls) =...Ch. 5.1 - Identifying Discrete and Continuous Random...Ch. 5.1 - Identifying Discrete and Continuous Random...Ch. 5.1 - Identifying Probability Distributions. In...Ch. 5.1 - Identifying Probability Distributions. In...Ch. 5.1 - Identifying Probability Distributions. In...Ch. 5.1 - Identifying Probability Distributions. In...
Ch. 5.1 - Identifying Probability Distributions. In...Ch. 5.1 - Identifying Probability Distributions. In...Ch. 5.1 - Identifying Probability Distributions. In...Ch. 5.1 - Identifying Probability Distributions. In...Ch. 5.1 - Genetics. In Exercises 1520, refer to the...Ch. 5.1 - Genetics. In Exercises 1520, refer to the...Ch. 5.1 - Genetics. In Exercises 1520, refer to the...Ch. 5.1 - Genetics. In Exercises 1520, refer to the...Ch. 5.1 - Genetics. In Exercises 1520, refer to the...Ch. 5.1 - Genetics. In Exercises 1520, refer to the...Ch. 5.1 - Sleepwalking. In Exercises 2125, refer to the...Ch. 5.1 - Sleepwalking. In Exercises 2125, refer to the...Ch. 5.1 - Sleepwalking. In Exercises 2125, refer to the...Ch. 5.1 - Sleepwalking. In Exercises 2125, refer to the...Ch. 5.1 - Sleepwalking. In Exercises 2125, refer to the...Ch. 5.1 - Expected Value for the Ohio Pick 4 Lottery In the...Ch. 5.1 - Expected Value in Virginias Pick 3 Game In...Ch. 5.1 - Expected Value in Roulette When playing roulette...Ch. 5.1 - Expected Value for Life Insurance There is a...Ch. 5.1 - Expected Value for Life Insurance There is a...Ch. 5.2 - Drone Deliveries Based on a Pitney Bowes survey,...Ch. 5.2 - Notation Assume that we want to find the...Ch. 5.2 - Independent Events Based on a Pitney Bowes survey,...Ch. 5.2 - Notation of 0 + Using the same survey from...Ch. 5.2 - Identifying Binomial Distributions. In Exercises...Ch. 5.2 - Identifying Binomial Distributions. In Exercises...Ch. 5.2 - Identifying Binomial Distributions. In Exercises...Ch. 5.2 - Identifying Binomial Distributions. In Exercises...Ch. 5.2 - Identifying Binomial Distributions. In Exercises...Ch. 5.2 - Identifying Binomial Distributions. In Exercises...Ch. 5.2 - Identifying Binomial Distributions. In Exercises...Ch. 5.2 - Identifying Binomial Distributions. In Exercises...Ch. 5.2 - Binomial Probability Formula. In Exercises 13 and...Ch. 5.2 - News Source Based on data from a Harris...Ch. 5.2 - SAT Test. In Exercises 1520, assume that random...Ch. 5.2 - SAT Test. In Exercises 1520, assume that random...Ch. 5.2 - SAT Test. In Exercises 1520, assume that random...Ch. 5.2 - SAT Test. In Exercises 1520, assume that random...Ch. 5.2 - SAT Test. In Exercises 1520, assume that random...Ch. 5.2 - SAT Test. In Exercises 1520, assume that random...Ch. 5.2 - In Exercises 2124, assume that when adults with...Ch. 5.2 - In Exercises 2124, assume that when adults with...Ch. 5.2 - In Exercises 2124, assume that when adults with...Ch. 5.2 - In Exercises 2124, assume that when adults with...Ch. 5.2 - Whitus v. Georgia In the classic legal case of...Ch. 5.2 - Vision Correction A survey sponsored by the Vision...Ch. 5.2 - See You Later Based on a Harris Interactive poll,...Ch. 5.2 - Too Young to Tat Based on a Harris poll, among...Ch. 5.2 - Significance with Range Rule of Thumb. In...Ch. 5.2 - Significance with Range Rule of Thumb. In...Ch. 5.2 - Significance with Range Rule of Thumb. In...Ch. 5.2 - Hybrids Assume that offspring peas are randomly...Ch. 5.2 - Composite Sampling. Exercises 33 and 34 involve...Ch. 5.2 - Anemia Based on data from Bloodjournal.org, 10% of...Ch. 5.2 - Acceptance Sampling. Exercises 35 and 36 involve...Ch. 5.2 - AAA Batteries AAA batteries are made by companies...Ch. 5.2 - MMs Data Set 27 MM Weights in Appendix B includes...Ch. 5.2 - Politics The County Clerk in Essex, New Jersey,...Ch. 5.2 - Perception and Reality In a presidential election,...Ch. 5.2 - Hybrids One of Mendels famous experiments with...Ch. 5.2 - Geometric Distribution If a procedure meets all...Ch. 5.2 - Multinomial Distribution The binomial distribution...Ch. 5.2 - Hypergeometric Distribution If we sample from a...Ch. 5.3 - Notation In analyzing hits by V-1 buzz bombs in...Ch. 5.3 - Tornadoes During a recent 64-year period, New...Ch. 5.3 - Poisson Probability Distribution The random...Ch. 5.3 - Probability if 0 For Formula 5-9, what does P(0)...Ch. 5.3 - Hurricanes. In Exercises 58, assume that the...Ch. 5.3 - Hurricanes a. Find the probability that in a year,...Ch. 5.3 - Hurricanes a. Find the probability that in a year,...Ch. 5.3 - Hurricanes a. Find the probability that in a year,...Ch. 5.3 - In Exercises 916, use the Poisson distribution to...Ch. 5.3 - Murders In a recent year, there were 333 murders...Ch. 5.3 - Radioactive Decay Radioactive atoms are unstable...Ch. 5.3 - Deaths from Horse Kicks A classical example of the...Ch. 5.3 - World War II Bombs In Exercise 1Notation we noted...Ch. 5.3 - Disease Cluster Neuroblastoma, a rare form of...Ch. 5.3 - Car Fatalities The recent rate of car fatalities...Ch. 5.3 - Checks In a recent year, the author wrote 181...Ch. 5.3 - Powerball: Poisson Approximation to Binomial There...Ch. 5 - Is a probability distribution defined if the only...Ch. 5 - There are 80 questions from an SAT test, and they...Ch. 5 - Are the values Found in Exercise 2 statistics or...Ch. 5 - Using the same SAT questions described in Exercise...Ch. 5 - Using the same SAT questions described in Exercise...Ch. 5 - In Exercises 610, use the following: Five American...Ch. 5 - In Exercises 610, use the following: Five American...Ch. 5 - Based on the table, the standard deviation is 0.9...Ch. 5 - 9. What does the probability of 0+ indicate? Does...Ch. 5 - In Exercises 6-10, use the following: Five...Ch. 5 - In Exercises 15, assume that 74% of randomly...Ch. 5 - In Exercises 15, assume that 74% of randomly...Ch. 5 - In Exercises 15, assume that 74% of randomly...Ch. 5 - In Exercises 15, assume that 74% of randomly...Ch. 5 - In Exercises 15, assume that 74% of randomly...Ch. 5 - Security Survey In a USA Today poll, subjects were...Ch. 5 - Brand Recognition In a study of brand recognition...Ch. 5 - Family/Partner Groups of people aged 1565 are...Ch. 5 - Detecting Fraud The Brooklyn District Attorneys...Ch. 5 - Poisson: Deaths Currently, an average of 7...Ch. 5 - Planets The planets of the solar system have the...Ch. 5 - South Carolina Pick 3 In South Carolinas Pick 3...Ch. 5 - Tennis Challenge In a recent U.S. Open tennis...Ch. 5 - Job Applicants The Society for Human Resource...Ch. 5 - Bar Graph Fox News broadcast a graph similar to...Ch. 5 - Washing Hands Based on results from a Bradley...Ch. 5 - Overbooking Flights American Airlines Flight 171...Ch. 5 - Critical Thinking: Did Mendels results from plant...
Additional Math Textbook Solutions
Find more solutions based on key concepts
8. Effect of Blinding Among 13,200 submitted abstracts that were blindly evaluated (with authors and institutio...
Elementary Statistics
Matching In Exercises 17–20, match the level of confidence c with the appropriate confidence interval. Assume e...
Elementary Statistics: Picturing the World (7th Edition)
Choose your test Use the test of your choice to determine whether the following series converge. 49. k=31lnk
Calculus: Early Transcendentals (2nd Edition)
Whether 22 is prime or composite number.
Pre-Algebra Student Edition
Fill in each blanks so that the resulting statement is true. Any set of ordered pairs is called a/an _______. T...
College Algebra (7th Edition)
Knowledge Booster


Learn more about
Need a deep-dive on the concept behind this application? Look no further. Learn more about this topic, statistics and related others by exploring similar questions and additional content below.Similar questions
- Consider an event X comprised of three outcomes whose probabilities are 9/18, 1/18,and 6/18. Compute the probability of the complement of the event. Question content area bottom Part 1 A.1/2 B.2/18 C.16/18 D.16/3arrow_forwardJohn and Mike were offered mints. What is the probability that at least John or Mike would respond favorably? (Hint: Use the classical definition.) Question content area bottom Part 1 A.1/2 B.3/4 C.1/8 D.3/8arrow_forwardThe details of the clock sales at a supermarket for the past 6 weeks are shown in the table below. The time series appears to be relatively stable, without trend, seasonal, or cyclical effects. The simple moving average value of k is set at 2. What is the simple moving average root mean square error? Round to two decimal places. Week Units sold 1 88 2 44 3 54 4 65 5 72 6 85 Question content area bottom Part 1 A. 207.13 B. 20.12 C. 14.39 D. 0.21arrow_forward
- The details of the clock sales at a supermarket for the past 6 weeks are shown in the table below. The time series appears to be relatively stable, without trend, seasonal, or cyclical effects. The simple moving average value of k is set at 2. If the smoothing constant is assumed to be 0.7, and setting F1 and F2=A1, what is the exponential smoothing sales forecast for week 7? Round to the nearest whole number. Week Units sold 1 88 2 44 3 54 4 65 5 72 6 85 Question content area bottom Part 1 A. 80 clocks B. 60 clocks C. 70 clocks D. 50 clocksarrow_forwardThe details of the clock sales at a supermarket for the past 6 weeks are shown in the table below. The time series appears to be relatively stable, without trend, seasonal, or cyclical effects. The simple moving average value of k is set at 2. Calculate the value of the simple moving average mean absolute percentage error. Round to two decimal places. Week Units sold 1 88 2 44 3 54 4 65 5 72 6 85 Part 1 A. 14.39 B. 25.56 C. 23.45 D. 20.90arrow_forwardThe accompanying data shows the fossil fuels production, fossil fuels consumption, and total energy consumption in quadrillions of BTUs of a certain region for the years 1986 to 2015. Complete parts a and b. Year Fossil Fuels Production Fossil Fuels Consumption Total Energy Consumption1949 28.748 29.002 31.9821950 32.563 31.632 34.6161951 35.792 34.008 36.9741952 34.977 33.800 36.7481953 35.349 34.826 37.6641954 33.764 33.877 36.6391955 37.364 37.410 40.2081956 39.771 38.888 41.7541957 40.133 38.926 41.7871958 37.216 38.717 41.6451959 39.045 40.550 43.4661960 39.869 42.137 45.0861961 40.307 42.758 45.7381962 41.732 44.681 47.8261963 44.037 46.509 49.6441964 45.789 48.543 51.8151965 47.235 50.577 54.0151966 50.035 53.514 57.0141967 52.597 55.127 58.9051968 54.306 58.502 62.4151969 56.286…arrow_forward
- The accompanying data shows the fossil fuels production, fossil fuels consumption, and total energy consumption in quadrillions of BTUs of a certain region for the years 1986 to 2015. Complete parts a and b. Year Fossil Fuels Production Fossil Fuels Consumption Total Energy Consumption1949 28.748 29.002 31.9821950 32.563 31.632 34.6161951 35.792 34.008 36.9741952 34.977 33.800 36.7481953 35.349 34.826 37.6641954 33.764 33.877 36.6391955 37.364 37.410 40.2081956 39.771 38.888 41.7541957 40.133 38.926 41.7871958 37.216 38.717 41.6451959 39.045 40.550 43.4661960 39.869 42.137 45.0861961 40.307 42.758 45.7381962 41.732 44.681 47.8261963 44.037 46.509 49.6441964 45.789 48.543 51.8151965 47.235 50.577 54.0151966 50.035 53.514 57.0141967 52.597 55.127 58.9051968 54.306 58.502 62.4151969 56.286…arrow_forwardThe accompanying data shows the fossil fuels production, fossil fuels consumption, and total energy consumption in quadrillions of BTUs of a certain region for the years 1986 to 2015. Complete parts a and b. Develop line charts for each variable and identify the characteristics of the time series (that is, random, stationary, trend, seasonal, or cyclical). What is the line chart for the variable Fossil Fuels Production?arrow_forwardThe accompanying data shows the fossil fuels production, fossil fuels consumption, and total energy consumption in quadrillions of BTUs of a certain region for the years 1986 to 2015. Complete parts a and b. Year Fossil Fuels Production Fossil Fuels Consumption Total Energy Consumption1949 28.748 29.002 31.9821950 32.563 31.632 34.6161951 35.792 34.008 36.9741952 34.977 33.800 36.7481953 35.349 34.826 37.6641954 33.764 33.877 36.6391955 37.364 37.410 40.2081956 39.771 38.888 41.7541957 40.133 38.926 41.7871958 37.216 38.717 41.6451959 39.045 40.550 43.4661960 39.869 42.137 45.0861961 40.307 42.758 45.7381962 41.732 44.681 47.8261963 44.037 46.509 49.6441964 45.789 48.543 51.8151965 47.235 50.577 54.0151966 50.035 53.514 57.0141967 52.597 55.127 58.9051968 54.306 58.502 62.4151969 56.286…arrow_forward
- For each of the time series, construct a line chart of the data and identify the characteristics of the time series (that is, random, stationary, trend, seasonal, or cyclical). Month PercentApr 1972 4.97May 1972 5.00Jun 1972 5.04Jul 1972 5.25Aug 1972 5.27Sep 1972 5.50Oct 1972 5.73Nov 1972 5.75Dec 1972 5.79Jan 1973 6.00Feb 1973 6.02Mar 1973 6.30Apr 1973 6.61May 1973 7.01Jun 1973 7.49Jul 1973 8.30Aug 1973 9.23Sep 1973 9.86Oct 1973 9.94Nov 1973 9.75Dec 1973 9.75Jan 1974 9.73Feb 1974 9.21Mar 1974 8.85Apr 1974 10.02May 1974 11.25Jun 1974 11.54Jul 1974 11.97Aug 1974 12.00Sep 1974 12.00Oct 1974 11.68Nov 1974 10.83Dec 1974 10.50Jan 1975 10.05Feb 1975 8.96Mar 1975 7.93Apr 1975 7.50May 1975 7.40Jun 1975 7.07Jul 1975 7.15Aug 1975 7.66Sep 1975 7.88Oct 1975 7.96Nov 1975 7.53Dec 1975 7.26Jan 1976 7.00Feb 1976 6.75Mar 1976 6.75Apr 1976 6.75May 1976…arrow_forwardHi, I need to make sure I have drafted a thorough analysis, so please answer the following questions. Based on the data in the attached image, develop a regression model to forecast the average sales of football magazines for each of the seven home games in the upcoming season (Year 10). That is, you should construct a single regression model and use it to estimate the average demand for the seven home games in Year 10. In addition to the variables provided, you may create new variables based on these variables or based on observations of your analysis. Be sure to provide a thorough analysis of your final model (residual diagnostics) and provide assessments of its accuracy. What insights are available based on your regression model?arrow_forwardI want to make sure that I included all possible variables and observations. There is a considerable amount of data in the images below, but not all of it may be useful for your purposes. Are there variables contained in the file that you would exclude from a forecast model to determine football magazine sales in Year 10? If so, why? Are there particular observations of football magazine sales from previous years that you would exclude from your forecasting model? If so, why?arrow_forward
arrow_back_ios
SEE MORE QUESTIONS
arrow_forward_ios
Recommended textbooks for you

 Holt Mcdougal Larson Pre-algebra: Student Edition...AlgebraISBN:9780547587776Author:HOLT MCDOUGALPublisher:HOLT MCDOUGAL
 Algebra and Trigonometry (MindTap Course List)AlgebraISBN:9781305071742Author:James Stewart, Lothar Redlin, Saleem WatsonPublisher:Cengage Learning
 College AlgebraAlgebraISBN:9781305115545Author:James Stewart, Lothar Redlin, Saleem WatsonPublisher:Cengage Learning
 College Algebra (MindTap Course List)AlgebraISBN:9781305652231Author:R. David Gustafson, Jeff HughesPublisher:Cengage Learning
Holt Mcdougal Larson Pre-algebra: Student Edition...
Algebra
ISBN:9780547587776
Author:HOLT MCDOUGAL
Publisher:HOLT MCDOUGAL
Algebra and Trigonometry (MindTap Course List)
Algebra
ISBN:9781305071742
Author:James Stewart, Lothar Redlin, Saleem Watson
Publisher:Cengage Learning
College Algebra
Algebra
ISBN:9781305115545
Author:James Stewart, Lothar Redlin, Saleem Watson
Publisher:Cengage Learning
College Algebra (MindTap Course List)
Algebra
ISBN:9781305652231
Author:R. David Gustafson, Jeff Hughes
Publisher:Cengage Learning
Mod-01 Lec-01 Discrete probability distributions (Part 1); Author: nptelhrd;https://www.youtube.com/watch?v=6x1pL9Yov1k;License: Standard YouTube License, CC-BY
Discrete Probability Distributions; Author: Learn Something;https://www.youtube.com/watch?v=m9U4UelWLFs;License: Standard YouTube License, CC-BY
Probability Distribution Functions (PMF, PDF, CDF); Author: zedstatistics;https://www.youtube.com/watch?v=YXLVjCKVP7U;License: Standard YouTube License, CC-BY
Discrete Distributions: Binomial, Poisson and Hypergeometric | Statistics for Data Science; Author: Dr. Bharatendra Rai;https://www.youtube.com/watch?v=lHhyy4JMigg;License: Standard Youtube License