
Introduction To Statistics And Data Analysis
6th Edition
ISBN: 9781337794503
Author: PECK
Publisher: Cengage
expand_more
expand_more
format_list_bulleted
Concept explainers
Videos
Textbook Question
Chapter 5.1, Problem 12E
Data from the U.S. Federal Reserve Board (federal reserve.gov/releases/housedebt/,retrieved April 21, 2017) on consumer debt (as a percentage of personal income) and mortgage debt (also as a percentage of personal income) for the 10 years from 2006 to 2015 are shown in the following table:
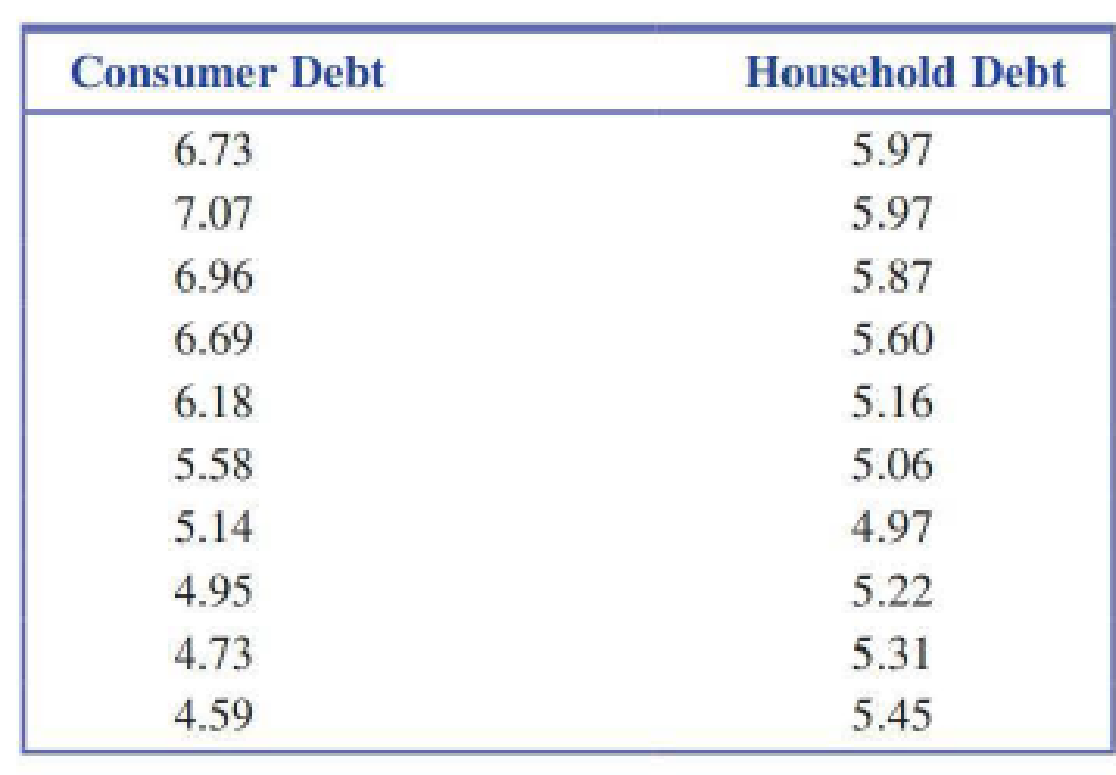
- a. What is the value of the
correlation coefficient for this data set? - b. Is it reasonable to conclude in this case that there is no strong relationship between the variables (linear or otherwise)? Use a graphical display to support your answer.
Expert Solution & Answer
Want to see the full answer?
Check out a sample textbook solution
Students have asked these similar questions
65% of all violent felons in the prison system are repeat offenders. If 43 violent felons are randomly selected, find the probability that
a. Exactly 28 of them are repeat offenders.
b. At most 28 of them are repeat offenders. c. At least 28 of them are repeat offenders. d. Between 22 and 26 (including 22 and 26) of them are repeat offenders.
08:34
◄ Classroom
07:59
Probs. 5-32/33
D
ا.
89
5-34. Determine the horizontal and vertical components
of reaction at the pin A and the normal force at the smooth
peg B on the member.
A
0,4 m
0.4 m
Prob. 5-34
F=600 N
fr
th
ar
0.
163586
5-37. The wooden plank resting between the buildings
deflects slightly when it supports the 50-kg boy. This
deflection causes a triangular distribution of load at its ends.
having maximum intensities of w, and wg. Determine w
and wg. each measured in N/m. when the boy is standing
3 m from one end as shown. Neglect the mass of the plank.
0.45 m
3 m
Examine the Variables: Carefully review and note the names of all variables in the dataset. Examples of these variables include:
Mileage (mpg)
Number of Cylinders (cyl)
Displacement (disp)
Horsepower (hp)
Research: Google to understand these variables.
Statistical Analysis: Select mpg variable, and perform the following statistical tests. Once you are done with these tests using mpg variable, repeat the same with hp
Mean
Median
First Quartile (Q1)
Second Quartile (Q2)
Third Quartile (Q3)
Fourth Quartile (Q4)
10th Percentile
70th Percentile
Skewness
Kurtosis
Document Your Results:
In RStudio: Before running each statistical test, provide a heading in the format shown at the bottom. “# Mean of mileage – Your name’s command”
In Microsoft Word: Once you've completed all tests, take a screenshot of your results in RStudio and paste it into a Microsoft Word document. Make sure that snapshots are very clear. You will need multiple snapshots. Also transfer these results to the…
Chapter 5 Solutions
Introduction To Statistics And Data Analysis
Ch. 5.1 - For each of the scatterplots shown, answer the...Ch. 5.1 - For each of the following pairs of variables,...Ch. 5.1 - For each of the following pairs of variables,...Ch. 5.1 - For each of the following pairs of variables,...Ch. 5.1 - Is the following statement correct? Explain why or...Ch. 5.1 - Draw a scatterplot for which r = 1.Ch. 5.1 - Draw a scatterplot for which r = 1.Ch. 5.1 - Each year J.D. Power and Associates surveys new...Ch. 5.1 - The accompanying data are x = Cost (cents per...Ch. 5.1 - The authors of the paper Flat-footedness Is Not a...
Ch. 5.1 - The paper The Relationship Between Cell Phone Use,...Ch. 5.1 - Data from the U.S. Federal Reserve Board (federal...Ch. 5.1 - The article 115K! The 13 Best Paying U.S....Ch. 5.1 - It may seem odd, but one of the ways biologists...Ch. 5.1 - An auction house released a list of 25 recently...Ch. 5.1 - A sample of automobiles traversing a certain...Ch. 5.2 - Two scatterplots are shown below. Explain why it...Ch. 5.2 - The authors of the paper Statistical Methods for...Ch. 5.2 - The accompanying data are a subset of data from...Ch. 5.2 - The authors of the paper Evaluating Existing...Ch. 5.2 - The authors of the paper referenced in the...Ch. 5.2 - A sample of 548 ethnically diverse students from...Ch. 5.2 - The relationship between hospital patient-to-nurse...Ch. 5.2 - The report Airline Quality Rating 2016...Ch. 5.2 - Acrylamide is a chemical that is sometimes found...Ch. 5.2 - Use the acrylamide data given in the previous...Ch. 5.2 - Studies have shown that people who suffer sudden...Ch. 5.2 - The data given in the previous exercise on x =...Ch. 5.2 - An article on the cost of housing in Califomia...Ch. 5.2 - The following data on sale price, size, and...Ch. 5.2 - Explain why it can be dangerous to use the...Ch. 5.2 - The sales manager of a large company selected a...Ch. 5.2 - Explain why the slope b of the least-squares line...Ch. 5.2 - Prob. 34ECh. 5.3 - Does it pay to stay in school? The report Trends...Ch. 5.3 - The data in the accompanying table is from the...Ch. 5.3 - The paper referenced in the previous exercise also...Ch. 5.3 - Consider the residual plot from the previous...Ch. 5.3 - The report Airline Quality Rating 2016...Ch. 5.3 - Acrylamide is a chemical that is sometimes found...Ch. 5.3 - Consider the scatterplot of acrylamide...Ch. 5.3 - Some types of algae have the potential to cause...Ch. 5.3 - The relationship between x = Total number of...Ch. 5.3 - The residuals from the least-squares line for the...Ch. 5.3 - The first Batman movie was made over 50 years ago...Ch. 5.3 - The article 115K! The 13 Best Paying U.S....Ch. 5.3 - The article Examined Life: What Stanley H. Kaplan...Ch. 5.3 - The accompanying data are a subset of data from...Ch. 5.3 - The article California State Parks Closure List...Ch. 5.3 - The article referenced in the previous exercise...Ch. 5.3 - A study was carried out to investigate the...Ch. 5.3 - Both r2 and se are used to assess the fit of a...Ch. 5.3 - Prob. 53ECh. 5.4 - The following data on x = Frying time (in seconds)...Ch. 5.4 - Use the information provided in the previous...Ch. 5.4 - The paper Aspects of Food Finding by Wintering...Ch. 5.4 - Food intake of grazing animals is limited by the...Ch. 5.4 - A study, described in the paper Prediction of...Ch. 5.4 - Prob. 59ECh. 5.4 - The following table gives the number of heart...Ch. 5.4 - Refer to the heart transplant data given in the...Ch. 5.4 - The paper Population Pressure and Agricultural...Ch. 5.4 - Determining the age of an animal can sometimes be...Ch. 5.5 - The paper How Lead Exposure Relates to Temporal...Ch. 5.5 - The following quote is from the paper Evaluation...Ch. 5 - The accompanying data represent x = Amount of...Ch. 5 - The paper A Cross-National Relationship Between...Ch. 5 - The following data on x = Score on a measure of...Ch. 5 - The paper Effects of Canine Parvovirus (CPV) on...Ch. 5 - The paper Depression, Body Mass Index, and Chronic...Ch. 5 - The paper Aspects of Food Finding by Wintering...Ch. 5 - Data on salmon availability (x) and the percentage...Ch. 5 - No tortilla chip lover likes soggy chips, so it is...Ch. 5 - The article Reduction is Soluble Protein and...Ch. 5 - The following quote is from the paper The Weight...Ch. 5 - An accurate assessment of oxygen consumption...Ch. 5 - Consider the four (x, y) pairs (0, 0), (1, 1), 1,...Ch. 5 - Prob. 1CRECh. 5 - Data from a survey of 1046 adults age 50 and older...Ch. 5 - Prob. 3CRECh. 5 - Prob. 4CRECh. 5 - Prob. 5CRECh. 5 - The amount of money spent each year on science,...Ch. 5 - Below are the data used to construct the time...Ch. 5 - In August 2009, Harris Interactive released the...Ch. 5 - Prob. 9CRECh. 5 - Prob. 10CRECh. 5 - Prob. 11CRECh. 5 - Prob. 12CRECh. 5 - Cost-to-charge ratios (the percentage of the...Ch. 5 - In the article Reproductive Biology of the Aquatic...Ch. 5 - Prob. 15CRECh. 5 - Anabolic steroid abuse has been increasing despite...Ch. 5 - Prob. 81ECh. 5 - Prob. 82ECh. 5 - Prob. 83ECh. 5 - Prob. 84ECh. 5 - Suppose the hypothetical data below are from a...Ch. 5 - Prob. 86E
Knowledge Booster


Learn more about
Need a deep-dive on the concept behind this application? Look no further. Learn more about this topic, statistics and related others by exploring similar questions and additional content below.Similar questions
- Examine the Variables: Carefully review and note the names of all variables in the dataset. Examples of these variables include: Mileage (mpg) Number of Cylinders (cyl) Displacement (disp) Horsepower (hp) Research: Google to understand these variables. Statistical Analysis: Select mpg variable, and perform the following statistical tests. Once you are done with these tests using mpg variable, repeat the same with hp Mean Median First Quartile (Q1) Second Quartile (Q2) Third Quartile (Q3) Fourth Quartile (Q4) 10th Percentile 70th Percentile Skewness Kurtosis Document Your Results: In RStudio: Before running each statistical test, provide a heading in the format shown at the bottom. “# Mean of mileage – Your name’s command” In Microsoft Word: Once you've completed all tests, take a screenshot of your results in RStudio and paste it into a Microsoft Word document. Make sure that snapshots are very clear. You will need multiple snapshots. Also transfer these results to the…arrow_forwardExamine the Variables: Carefully review and note the names of all variables in the dataset. Examples of these variables include: Mileage (mpg) Number of Cylinders (cyl) Displacement (disp) Horsepower (hp) Research: Google to understand these variables. Statistical Analysis: Select mpg variable, and perform the following statistical tests. Once you are done with these tests using mpg variable, repeat the same with hp Mean Median First Quartile (Q1) Second Quartile (Q2) Third Quartile (Q3) Fourth Quartile (Q4) 10th Percentile 70th Percentile Skewness Kurtosis Document Your Results: In RStudio: Before running each statistical test, provide a heading in the format shown at the bottom. “# Mean of mileage – Your name’s command” In Microsoft Word: Once you've completed all tests, take a screenshot of your results in RStudio and paste it into a Microsoft Word document. Make sure that snapshots are very clear. You will need multiple snapshots. Also transfer these results to the…arrow_forward2 (VaR and ES) Suppose X1 are independent. Prove that ~ Unif[-0.5, 0.5] and X2 VaRa (X1X2) < VaRa(X1) + VaRa (X2). ~ Unif[-0.5, 0.5]arrow_forward
- 8 (Correlation and Diversification) Assume we have two stocks, A and B, show that a particular combination of the two stocks produce a risk-free portfolio when the correlation between the return of A and B is -1.arrow_forward9 (Portfolio allocation) Suppose R₁ and R2 are returns of 2 assets and with expected return and variance respectively r₁ and 72 and variance-covariance σ2, 0%½ and σ12. Find −∞ ≤ w ≤ ∞ such that the portfolio wR₁ + (1 - w) R₂ has the smallest risk.arrow_forward7 (Multivariate random variable) Suppose X, €1, €2, €3 are IID N(0, 1) and Y2 Y₁ = 0.2 0.8X + €1, Y₂ = 0.3 +0.7X+ €2, Y3 = 0.2 + 0.9X + €3. = (In models like this, X is called the common factors of Y₁, Y₂, Y3.) Y = (Y1, Y2, Y3). (a) Find E(Y) and cov(Y). (b) What can you observe from cov(Y). Writearrow_forward
- 1 (VaR and ES) Suppose X ~ f(x) with 1+x, if 0> x > −1 f(x) = 1−x if 1 x > 0 Find VaRo.05 (X) and ES0.05 (X).arrow_forwardJoy is making Christmas gifts. She has 6 1/12 feet of yarn and will need 4 1/4 to complete our project. How much yarn will she have left over compute this solution in two different ways arrow_forwardSolve for X. Explain each step. 2^2x • 2^-4=8arrow_forward
- One hundred people were surveyed, and one question pertained to their educational background. The results of this question and their genders are given in the following table. Female (F) Male (F′) Total College degree (D) 30 20 50 No college degree (D′) 30 20 50 Total 60 40 100 If a person is selected at random from those surveyed, find the probability of each of the following events.1. The person is female or has a college degree. Answer: equation editor Equation Editor 2. The person is male or does not have a college degree. Answer: equation editor Equation Editor 3. The person is female or does not have a college degree.arrow_forwardneed help with part barrow_forwardSuppose you know that Bob's test score is above the mean, but he doesn't remember by how much. At least how many students must score lower than Bob?arrow_forward
arrow_back_ios
SEE MORE QUESTIONS
arrow_forward_ios
Recommended textbooks for you
 Big Ideas Math A Bridge To Success Algebra 1: Stu...AlgebraISBN:9781680331141Author:HOUGHTON MIFFLIN HARCOURTPublisher:Houghton Mifflin Harcourt
 Glencoe Algebra 1, Student Edition, 9780079039897...AlgebraISBN:9780079039897Author:CarterPublisher:McGraw Hill
 Holt Mcdougal Larson Pre-algebra: Student Edition...AlgebraISBN:9780547587776Author:HOLT MCDOUGALPublisher:HOLT MCDOUGAL
Big Ideas Math A Bridge To Success Algebra 1: Stu...
Algebra
ISBN:9781680331141
Author:HOUGHTON MIFFLIN HARCOURT
Publisher:Houghton Mifflin Harcourt
Glencoe Algebra 1, Student Edition, 9780079039897...
Algebra
ISBN:9780079039897
Author:Carter
Publisher:McGraw Hill
Holt Mcdougal Larson Pre-algebra: Student Edition...
Algebra
ISBN:9780547587776
Author:HOLT MCDOUGAL
Publisher:HOLT MCDOUGAL
Correlation Vs Regression: Difference Between them with definition & Comparison Chart; Author: Key Differences;https://www.youtube.com/watch?v=Ou2QGSJVd0U;License: Standard YouTube License, CC-BY
Correlation and Regression: Concepts with Illustrative examples; Author: LEARN & APPLY : Lean and Six Sigma;https://www.youtube.com/watch?v=xTpHD5WLuoA;License: Standard YouTube License, CC-BY