Concept explainers
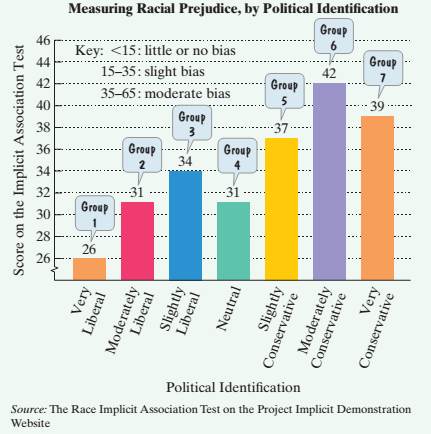
The bar graph at the top of the next column shown the differences among political identification groups on the Implicit Association Test that measures levels of racial prejudice. Higher scores indicate stronger bias.
- The data can be described by the following polynomial model of degree 3:
In this polynomial model, S represents the score on the Implicit Association Test for political identification group x. Simplify the model.
b. Use the simplified from of the model from part (a) to find the score on the Implicit Association Test for the slightly conservative political identification group. Does the model underestimate or overestimate the score displayed by the bar graph? By how much?
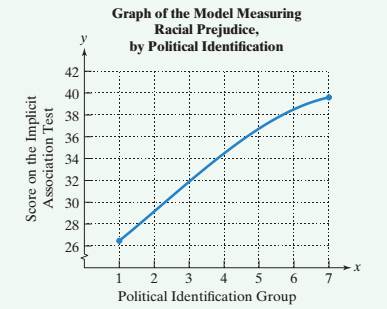
c. Show in a rectangular
Want to see the full answer?
Check out a sample textbook solutionChapter 5 Solutions
INTRO.+INTERMED.ALG.F/COLL....-ACCESS
- What are the advantages and disadvantages of piecewise polynomial interpolation?arrow_forwardFind a polynomial that fits the points (−2, 3), (−1, 5), (0, 1), (1, 4), and (2, 10).arrow_forwardQ6B The World Bank collected data on the percentage of GDP that a country spends on health expenditures ("Health expenditure," 2013) and also the percentage of women receiving prenatal care ("Pregnant woman receiving," 2013). The data for 14 countries where this information is available for the year 2011 are in following table (note: outlier data has been removed): Data of Health Expenditure versus Prenatal Care Health Expenditure (% of GDP) Prenatal Care (%) 3.7 54.6 5.2 93.7 5.2 84.7 10.0 100.0 4.7 42.5 4.8 96.4 6.0 77.1 5.4 58.3 4.8 95.4 4.1 78.0 6.0 93.3 9.5 93.3 6.8 93.7 6.1 89.8 Test at the 5% level for a correlation between percentage spent on health expenditure and the percentage of women receiving prenatal care. (iv) Calculate and enter test statistic Enter value in decimal form rounded to nearest hundredth, with appropriate sign (no spaces). Examples of correctly entered…arrow_forward
- Baseball statisticians sometimes employ transformations of statistics to allow comparisons of performances between eras. For instance, to project home run totals during the "dead ball era" (the era from about 1900 to 1919) to those of today, statisticians might use the transformation y = 2x+15.5, where y is a modern home run total and x is a home run total from the dead ball era. Suppose that the mean home run total among top players during one season in the dead ball era was 3.5, with a standard deviation of 1.7. 1. If these dead ball era home run totals were projected to modern home run totals, what would their || mean be? Do not round your response. 2. If these dead ball era home run totals were projected to modern home run totals, what would their|| standard deviation be? Do not round your response.arrow_forwardGrowth data of a sunflower plant is given in the following table: Week 3 5 7 9 | 11 13 1 Height (cm) 22 127 202 227 248 252 51 (a) Curve-fit the data with a third-order polynomial. Use the polynomial to estimate the height in week 6. (b) Fit the data with linear and spline interpolations and use each interpola- tion to estimate the height in week 6. In each part make a plot of the data points (circle markers) and the fitted curve or the interpolated curves. Note that part (b) has two interpolation curves.arrow_forwardA retailer wants to see if a red "Sale" sign brings in less revenue than the same "Sale" sign in blue. The data below shows the revenue in thousands of dollars that was achieved for various days when the retailer decided to put the red "Sale" sign up and days when the retailer decided to put the blue "Sale" sign up. Red: 2.6, 3.2, 3.4, 1, 2.6, 4.6, 2.7, 3.3, 3.2, 2.4 Blue: 3.7, 4.6, 4.2, 4.1, 3.6, 2.1, 4.7, 3.6 Assume that both populations follow a normal distribution. What can be concluded at the α = 0.05 level of significance level of significance? For this study, we should use? The null and alternative hypotheses would be: H0: (please enter a decimal) H1: (Please enter a decimal) The test statistic = (please show your answer to 3 decimal places.) The p-value = (Please show your answer to 4 decimal places.) The p-value is ? α Based on this, we should ? the null hypothesis. Thus, the final conclusion…arrow_forward
- The diversity index, from 0 to 100, measures the chance that two randomly selected people are a different race or ethnicity. The diversity index in the United States varies widely from region to region, from as high as 81 in Hawaii to as low as 11 in Vermont. The bar graph shows the national diversity index for the United States for four years in the period from 1980 through 2010.The data in the graph can be modeled by the formulaD = 0.005x2 + 0.55x + 34,where D is the national diversity index in the United States x years after 1980. According to the formula, what was the U.S. diversity index in 2010? How does this compare with the index displayed by the bar graph?arrow_forwardA retailer wants to see if a red "Sale" sign brings in less revenue than the same "Sale" sign in blue. The data below shows the revenue in thousands of dollars that was achieved for various days when the retailer decided to put the red "Sale" sign up and days when the retailer decided to put the blue "Sale" sign up. Red: 2.1, 3.6, 3.5, 2.5, 2, 3, 2.6, 2.6, 2, 3, 2.7 Blue: 2.6, 4.5, 4.1, 5, 4.6, 2.8, 3.9, 4.8 Assume that both populations follow a normal distribution. What can be concluded at the a = 0.10 level of significance level of significance? For this study, we should use Select an answer a. The null and alternative hypotheses would be: Но Select an answer V (please enter a decimal) Ho: Select an answer V Select an answer V H (Please enter a decimal) Select an answer Y Select an aNSwer V Select an answer b. The test statistic ?v = (please show your answer to 3 decimal places.) с. The p-valuе (Please show your answer to 4 decimal places.) d. The p-value is ?V a e. Based on this, we…arrow_forwardWhat is the leading term of the polynomial (V2r? –arrow_forward
- We begin the process of factoring a polynomial by first factoring out the assuming that there is one other than 1.arrow_forwardMovie dramas Here’s a scatterplot of the productionbudgets (in millions of dollars) vs. the running time (inminutes) for major release movies in 2005. Dramas areplotted as red x’s and all other genres are plotted as bluedots. (The re-make of King Kong is plotted as a black “-”.At the time it was the most expensive movie ever made,and not typical of any genre.) A separate least squares regression line has been fitted to each group. For the fol-lowing questions, just examine the plot:a) What are the units for the slopes of these lines?b) In what way are dramas and other movies similar withrespect to this relationship?c) In what way are dramas different from other genres ofmovies with respect to this relationship?arrow_forwardA retailer wants to see if a red "Sale" sign brings in the same amount of revenue than the same "Sale" sign in blue. The data below shows the revenue in thousands of dollars that was achieved for various days when the retailer decided to put the red "Sale" sign up and days when the retailer decided to put the blue "Sale" sign up. Red: 2.4, 3, 3.6, 1.8, 3, 2.7, 2.9, 3, 3.1 Blue: 1.7, 2.1, 1.4, 2.6, 0.6, 3, 3.5, 1.6, 0.3 Assume that both populations follow a normal distribution. What can be concluded at the αα = 0.05 level of significance level of significance? The test statistic ? t = _______________ (please show your answer to 3 decimal places.) The p-value = __________________ (Please show your answer to 4 decimal places.)arrow_forward
- Algebra & Trigonometry with Analytic GeometryAlgebraISBN:9781133382119Author:SwokowskiPublisher:Cengage