Concept explainers
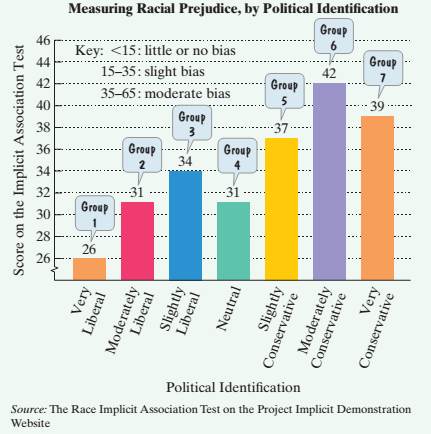
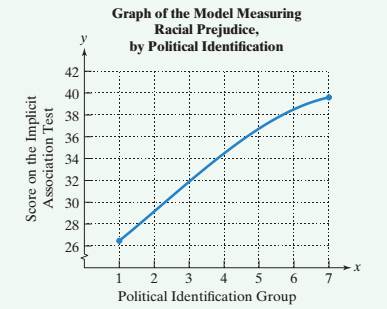
The bar graph at the top of the next column shown the differences among political identification groups on the Implicit Association Test that measures levels of racial prejudice. Higher scores indicate stronger bias.

- The data can be described by the following polynomial model of degree 3:
In this polynomial model, S represents the score on the Implicit Association Test for political identification group x. Simplify the model.
b. Use the simplified from of the model from part (a) to find the score on the Implicit Association Test for the slightly conservative political identification group. Does the model underestimate or overestimate the score displayed by the bar graph? By how much?
c. Show in a rectangular

Want to see the full answer?
Check out a sample textbook solution
Chapter 5 Solutions
EBK INTRODUCTORY AND INTERMEDIATE ALGEB
- Please use manual solution.arrow_forwardA constant temperature, pressure-volume thermodynamic process has the following data: Pressure 420 368 333 316 326 312 242 207 (kPa) Volume (m3) 0.5 2 4 6 8 10 11 Estimate the pressure at V = 1.88 m3 using 3 Points Lagrange interpolation polynomial.arrow_forward6. Find the best fit by a first degree polynomial for the following data: ( ) -3 -1 0 2 y 8 5 4 1arrow_forward
- Fit a second-order polynomial to the data given in the table 1 3 4 6 y 2.1 7.7 13.6 27.2 40.9 80.3arrow_forwardGiven n+1 data pairs, a unique polynomial of degree passes through n +1 data points. Select one: a. n+1 O b. n or less С. n d. n+1 or lessarrow_forward(b) Fit a second degree polynomial to the following data : Year : 1882 1883 1884 1885 1886 1887 1888 1889 1890 Price Index: 84 82 76 72 69 68 70 72 73arrow_forward
- Activity 1 Direction: Determine whether each expression is a polynomial or NOT. 1. x2 + 2x + 1 = 0 6. 2 x2- 1 = 0 11. 2x2 + 3x + 1 0 2. 5x³ + = 0 7.% x* y3-21x = 0 12. x2 + Vx - 8 = 0 3. 5x 2+5 = 0 8. 9 + vx - 3 = 0 13. 4x³ = 0 4. 10x* 2x + 1 = 0 "9. vy + 2 = 0 14.- -3 = 0 5. -x2 + 10 = 0 10.4 x3 + 2x = 0 15. X20 - 1 = 0arrow_forwardConsider the data (1,10), (3,6)(1,10), (3,6). Then, Newton's polynomial that interpolates the data is Select one: a. p(x)=10−2(x−10)p(x)=10−2(x−10) b. p(x)=10−2(x−3)p(x)=10−2(x−3) c. p(x)=10−2xp(x)=10−2x d. p(x)=12−2xp(x)=12−2x e. p(x)=10(x−1)−2(x−1)(x−3)arrow_forward(b) The following list shows some values obtained from a polynomial of degree four for a particular experiment. One value is suspected to have an error. Draw a difference table and identify the erroneous value and its true value. 18, 19, 34, 99, 256, 643, 1314, 2419, 4114 The value with an error is The true value must bearrow_forward
- The Brazilian Amazon rain forest is the world’s largest tropical rain forest, with some of the greatest biodiversity of any region. In 2012, the number of trees cut down in the Amazon dropped to its lowest level in 20 years. The line graph (see attached) shows the number of square kilometers cleared from 2001 through 2012. The data in the line graph can be modeled by the following third- and fourth-degree polynomial functions (see attached): Then Solve; a. Use the Leading Coefficient Test to determine the end behavior to the right for the graph of f. b. Assume that the rate at which the Amazon rain forest is being cut down continues to decline. Based on your answer to part (a), will f be useful in modeling Amazon deforestation over an extended period of time? Explain your answer. c. Use the Leading Coefficient Test to determine the end behavior to the right for the graph of g. d. Assume that the rate at which the Amazon rain forest is being cut down continues to decline. Based on your…arrow_forwardPlease answer this question quick, thank you!arrow_forwardQ3 Fit a second-order polynomial to the data in the following table. 0.25 0.5 1.2840 1.6487 Xi Yi 0 1 0.75 2.1170 1 2.7183arrow_forward
- Algebra & Trigonometry with Analytic GeometryAlgebraISBN:9781133382119Author:SwokowskiPublisher:Cengage
