
Concept explainers
Videos
Refer to the
- i. P(S)
- ii. P(W)
- iii. P(S|W)
- iv. P(S|B)
- v. P(S and W)
- vi. P(N and B)
Smoking by Race for Males Aged 18–24
a.
Calculate each probability (i-vi) and explain it meaning in words.
Answer to Problem 94CE
i. The probability
ii. The probability
iii. The probability
iv. The probability
v. The probability
vi. The probability
Explanation of Solution
Calculation:
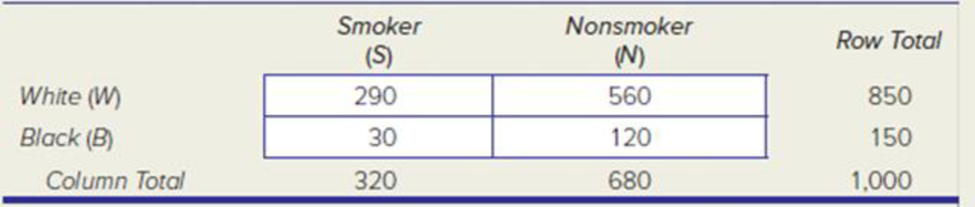
The given table shows that the smoking by race for males aged 18-24.
The given contingency table is,
| Smoker (S) | Nonsmoker (N) | Row Total | |
| White (W) | 290 | 560 | 850 |
| Black (B) | 30 | 120 | 150 |
| Column Total | 320 | 680 | 1,000 |
For (i)
The formula for finding the probability
Substitute 320 for ‘Frequency for the class S’ and 1,000 for ‘Total frequencies in the distribution’
Therefore, the probability
For (ii)
The formula for finding the probability
Substitute 850 for ‘Frequency for the class W’ and 1,000 for ‘Total frequencies in the distribution’
Therefore, the probability
For (iii)
The formula for finding the probability
Substitute 290 for ‘Frequency for the class S and W’ and 850 for ‘Frequency for the class W’,
Therefore, the probability
For (iv)
The formula for finding the probability
Substitute 30 for ‘Frequency for the class S and B’ and 150 for ‘Frequency for the class B’,
Therefore, the probability
For (v)
The formula for finding the probability
Substitute 290 for ‘Frequency for the class S and W’ and 1,000 for ‘Total frequencies in the distribution’,
Therefore, the probability
For (vi)
The formula for finding the probability
Substitute 120 for ‘Frequency for the class N and B’ and 1,000 for ‘Total frequencies in the distribution’,
Therefore, the probability
b.
Check whether there is evidence that smoking and race are not independent or not. Explain the reason.
Answer to Problem 94CE
Yes, there is evidence that smoking and race are not independent because
Explanation of Solution
Calculation:
Special law of multiplication:
If two events A and B are independent, then
Consider smoking type smoker and race type as white.
From part (a),
The formula for checking independence is,
Consider smoking type smoker and race type as black.
The formula for checking independence is,
Here, it is observed that
c.
Check whether the given smoking rates shown here correspond to the person experience.
Answer to Problem 94CE
Yes, the given smoking rates shown here correspond to the person experience.
Explanation of Solution
Answers may vary: one of the answers is given below.
In experience, it is found that smoking has great influence on the racing.
Also in part (b), it is observed that the smoking and race are dependent. That is smoking is influencing the race. Thus, both experience and the smoking rates tells that same.
Therefore, the given smoking rates shown here correspond to the person experience.
d.
Explain the reason for public health officials are interested in the given type of data.
Explanation of Solution
From part (b), it can be observed that the smoking is dependent on race.
Here, the public health officials will design the special programs for the given types of data when the smoking is dependent on race.
Want to see more full solutions like this?
Chapter 5 Solutions
Gen Combo Ll Applied Statistics In Business & Economics; Connect Access Card


- Given your fitted regression line, what would be the residual for snake #5 (10 C)?arrow_forwardCalculate the 95% confidence interval around your estimate of r using Fisher’s z-transformation. In your final answer, make sure to back-transform to the original units.arrow_forwardCalculate Pearson’s correlation coefficient (r) between temperature and heart rate.arrow_forward
- A researcher wishes to estimate, with 90% confidence, the population proportion of adults who support labeling legislation for genetically modified organisms (GMOs). Her estimate must be accurate within 4% of the true proportion. (a) No preliminary estimate is available. Find the minimum sample size needed. (b) Find the minimum sample size needed, using a prior study that found that 65% of the respondents said they support labeling legislation for GMOs. (c) Compare the results from parts (a) and (b). ... (a) What is the minimum sample size needed assuming that no prior information is available? n = (Round up to the nearest whole number as needed.)arrow_forwardThe table available below shows the costs per mile (in cents) for a sample of automobiles. At a = 0.05, can you conclude that at least one mean cost per mile is different from the others? Click on the icon to view the data table. Let Hss, HMS, HLS, Hsuv and Hмy represent the mean costs per mile for small sedans, medium sedans, large sedans, SUV 4WDs, and minivans respectively. What are the hypotheses for this test? OA. Ho: Not all the means are equal. Ha Hss HMS HLS HSUV HMV B. Ho Hss HMS HLS HSUV = μMV Ha: Hss *HMS *HLS*HSUV * HMV C. Ho Hss HMS HLS HSUV =μMV = = H: Not all the means are equal. D. Ho Hss HMS HLS HSUV HMV Ha Hss HMS HLS =HSUV = HMVarrow_forwardQuestion: A company launches two different marketing campaigns to promote the same product in two different regions. After one month, the company collects the sales data (in units sold) from both regions to compare the effectiveness of the campaigns. The company wants to determine whether there is a significant difference in the mean sales between the two regions. Perform a two sample T-test You can provide your answer by inserting a text box and the answer must include: Null hypothesis, Alternative hypothesis, Show answer (output table/summary table), and Conclusion based on the P value. (2 points = 0.5 x 4 Answers) Each of these is worth 0.5 points. However, showing the calculation is must. If calculation is missing, the whole answer won't get any credit.arrow_forward
 Holt Mcdougal Larson Pre-algebra: Student Edition...AlgebraISBN:9780547587776Author:HOLT MCDOUGALPublisher:HOLT MCDOUGAL
 Algebra and Trigonometry (MindTap Course List)AlgebraISBN:9781305071742Author:James Stewart, Lothar Redlin, Saleem WatsonPublisher:Cengage Learning
 College AlgebraAlgebraISBN:9781305115545Author:James Stewart, Lothar Redlin, Saleem WatsonPublisher:Cengage Learning
 Algebra & Trigonometry with Analytic GeometryAlgebraISBN:9781133382119Author:SwokowskiPublisher:Cengage