
(Based on the diagram):
For the last 80 years the U.S government has used
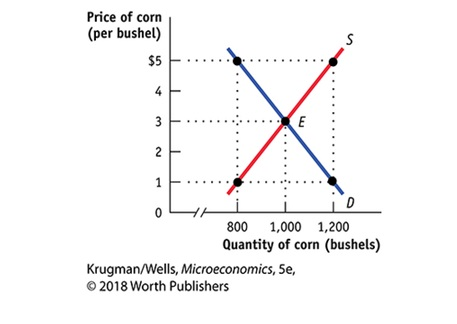
- When the government sets a
floor price of $5 per bushel of corn, the number of bushels of corn produced, the number of bushels the consumers purchase, the amount the government purchases, the cost of the program to the government and the revenue earned by the farmers. - If the government sets a target price of $5 per bushels for any quantity up to 1,000 bushels, the number of bushels the consumers will buy and the price, the number of bushels the government will purchase, the cost of the program to the government and the revenue earned by the farmers.
- The program, in which the price of corn is more to the consumers and the program where the cost is more to the government.
- Explain whether one of these policies less inefficient than the other
Concept Introduction:
Floor Price:
It is a government-imposed price control or limits on the minimum price that can be charged for a product. A floor price must be higher than the market price to be effective.
Target Price:
A policy where the government pays the farmers an amount equal to the difference between the market price and the target price for each unit of the output sold.
Deadweight loss can be stated as the loss of total surplus due to taxes or subsidies,
Want to see the full answer?
Check out a sample textbook solution

- Problem 3 ABC Challenges: Attrition, Balance and Compliance Can television inform people about public affairs? Political scientists Bethany Albertson and Adria Lawrence (2009) conducted an experiment in which they randomly assigned people to treatment and control groups to evaluate the effect of watching TV on a person's information level. Those assigned to the treatment group were told to watch a specific television broadcast and were later asked questions related to what they watched. Those in the control group were not shown the TV broadcast but were asked questions related to the material in the TV broadcast. The dataset contains the following variables: • • • • • • Read News: Dummy variable which =1 if a person reads news and 0 otherwise. Political Interest: interest in political affairs (not interested=1 to very interested=4) Education: years of education Female: female dummy variable (female=1; male=0) Income: family income in thousands of dollars Information Level: information…arrow_forwardThe figure to the right gives an economy's initial aggregate demand (AD) curve. Using the line drawing tool, show an increase in aggregate demand. Properly label this line. Part 2 Note: Carefully follow the instructions above and only draw the required object. Part 3 Which of the following will generate an increase in aggregate demand? A. A decrease in the price level. B. A decrease in the money supply. C. Increased government expenditures for war. D. A tax increase.arrow_forwardProblem 2 Experiments/Randomized Control Trial Suppose you are interested in studying the effect of academic counselling on the years it takes for a student to obtain an undergraduate degree. You conduct a randomized control trial to answer the question. You randomly assign 2500 individuals in a university in New York to receive academic counselling and 2500 students to not receive any academic counselling. a. Which people are a part of the treatment group and which people are a part of the control group? (5 points) b. What regression will you run? Define the variables where required. (5 points) Λ c. Suppose you estimate ß₁ = -0.3. Interpret it. (5 points) 1 d. You test for balance using the variables mentioned in the table below. Based on the results do you think that the treatment and control group are balanced? If your answer is "yes" then explain why. If your answer is "no", then explain why and mention how will you address the issue of imbalance. (10 points) Variable GPA Average…arrow_forward
- Problem 1 Experiments/Randomized Control Trial Suppose you are interested in studying the effect of being a part of the labor union on an individual's hourly wage. You collect data on 1000 people and run the following regression. Wage=Bo+B₁Labor Union; + &¿ where Labor Union is a dummy variable which is equal t to 1 for people who are a part of labor union and 0 for others. a. Suppose you estimate b. Do you think B₁ = 1.6. Interpret B₁ (5 points) 1 1 is biased or unbiased? Explain. (5 points) Now suppose you conduct a randomized control trial to answer the same question. You randomly assign some individuals to be a part of the labor union and others to not be a part of the labor union. The first step you take is to ensure that the randomization was done correctly. Then you estimate the following equation: = Wage, Bo+B₁Treatment; + &; Treatment =1 if the student is assigned to be a part of Labor Union Treatment=0 if the student is assigned to not be a part of Labor Union c. Why is it…arrow_forwardThe figure to the right contains a point indicating the economy's initial price and aggregate output (Upper P 0P0,Upper Y 0Y0) combination. Suppose that the price level rises such that P Subscript 1 > P Subscript 0. Using the point drawing tool, identify a potential location for the economy's new price and aggregate output (Upper P 1P1,Upper Y 1Y1) combination. Label this point B. Using the line drawing tool, draw the aggregate demand curve through these points. Properly label the line. picture is attachedarrow_forwardQuestion content area left Part 1 The figure to the right gives an economy's initial aggregate demand (AD) curve. Using the line drawing tool, show a decrease in aggregate demand. Properly label this line. Part 2 Note: Carefully follow the instructions above and only draw the required object. Part 3 Which of the following will generate a decrease in aggregate demand? A. Increased government expenditures for infrastructure. B. A tax increase. C. An increase in the price level. D. An increase in the money supply.arrow_forward
- A movie theater is showing two different movies: a Hollywood blockbuster (with 100 customers willing to pay $10 for a ticket, and 100 willing to pay $8) and an independent film that attracts 50 film buffs, willing to pay $20 each. Marginal costs are zero and neither movie can fill theater capacity. What is the theater's maximum profit if it cannot price discriminate (it must charge the same price for both movies) and if it can price discriminate (it may charge different prices for different movies)? a. $2,000; $2,600 b. $1,500; $2,100 c. $1,500; $2,000arrow_forwardA movie theater is showing two different movies: a Hollywood blockbuster (with 100 customers willing to pay $10 for a ticket, and 100 willing to pay $8) and an independent film that attracts 50 film buffs, willing to pay $20 each. Marginal costs are zero and neither movie can fill theater capacity. What is the theater's maximum profit if it cannot price discriminate (it must charge the same price for both movies) and if it can price discriminate (it may charge different prices for different movies)? a. $2,000; $2,600 b. $1,500; $2,100 c. $1,500; $2,000arrow_forwardWhat profi is most important in business ?arrow_forward
- 5. Download the Excel sheet from Brightspace. The data contains the GDP per capita and GNI per capita of OECD member countries in 2014 (both figures are reported in US dollars). The countries are ranked by GDP per capita. a. Compute the ratio of GNI to GDP for each country (GNI per capita/GDP per capita). What does this imply about net factor income from abroad for each country? b. Rank the countries based on the GNI/GDP ratio, starting with the country with the highest ratio and ending with the country with the lowest ratio. Which country has the highest ratio, and which has the lowest? c. Comment on why the countries you identified in the previous question have a large difference between GDP and GNI? What does the difference imply?arrow_forward3. Answer the following questions about external wealth. a. Home has external wealth of $100 million in period t. In t+1, Home purchases $160 million foreign assets, and Foreign purchases $120 million in Home assets. Assume a world interest rate of 10% per annum. Compute the "change" in external wealth at t+1 for Home. b. A country's external wealth was -$1.5 billion at the end of 2015, and its trade balance was $750 million in 2016. Assume the world interest rate is 5% per annum. What is the "value" of a country's external wealth at the end of 2016?arrow_forward1. The table below shows a country's hypothetical national income and product accounts data. Category Consumption (personal consumption expenditures) Investment (gross private domestic investment) Government consumption (government expenditures) Exports Imports Net Factor Income from Abroad Net unilateral transfers Billions of Dollars 8,000 1,300 2,100 900 1,750 +45 -20 a. Compute the following accounts using the information in the table: Gross national expenditure (GNE) . Trade balance (TB) • Gross domestic product (GDP) • Gross national income (GNI) . Gross national disposable income (GNDI) Current account (CA) b. Derive the current account identity using the national income identity. Are savings greater than or smaller than investment in this country? The national income identity is: GNDIGNE + CA, GNE = C + G + I.arrow_forward

 Principles of Economics (12th Edition)EconomicsISBN:9780134078779Author:Karl E. Case, Ray C. Fair, Sharon E. OsterPublisher:PEARSON
 Engineering Economy (17th Edition)EconomicsISBN:9780134870069Author:William G. Sullivan, Elin M. Wicks, C. Patrick KoellingPublisher:PEARSON
 Principles of Economics (MindTap Course List)EconomicsISBN:9781305585126Author:N. Gregory MankiwPublisher:Cengage Learning
 Managerial Economics: A Problem Solving ApproachEconomicsISBN:9781337106665Author:Luke M. Froeb, Brian T. McCann, Michael R. Ward, Mike ShorPublisher:Cengage Learning
 Managerial Economics & Business Strategy (Mcgraw-...EconomicsISBN:9781259290619Author:Michael Baye, Jeff PrincePublisher:McGraw-Hill Education