
Concept explainers
Plot the shear diagram, bending moment diagram, axial force diagram, and the qualitative deflected shape of the frame.
Explanation of Solution
Write the condition for static instability, determinacy and indeterminacy of plane frames as follows:
Here, number of members is m, number of external reactions is r, the number of joints is j, and the number of elastic hinges is
Find the degree of static indeterminacy (i) using the equation;
Refer to the Figure in the question;
The number of members (m) is 3.
The number of external reactions (r) is 4.
The number of joints (j) is 4.
The number of elastic hinges
Substitute the values in Equation (2);
Show the free-body diagram of the entire frame as in Figure 1.
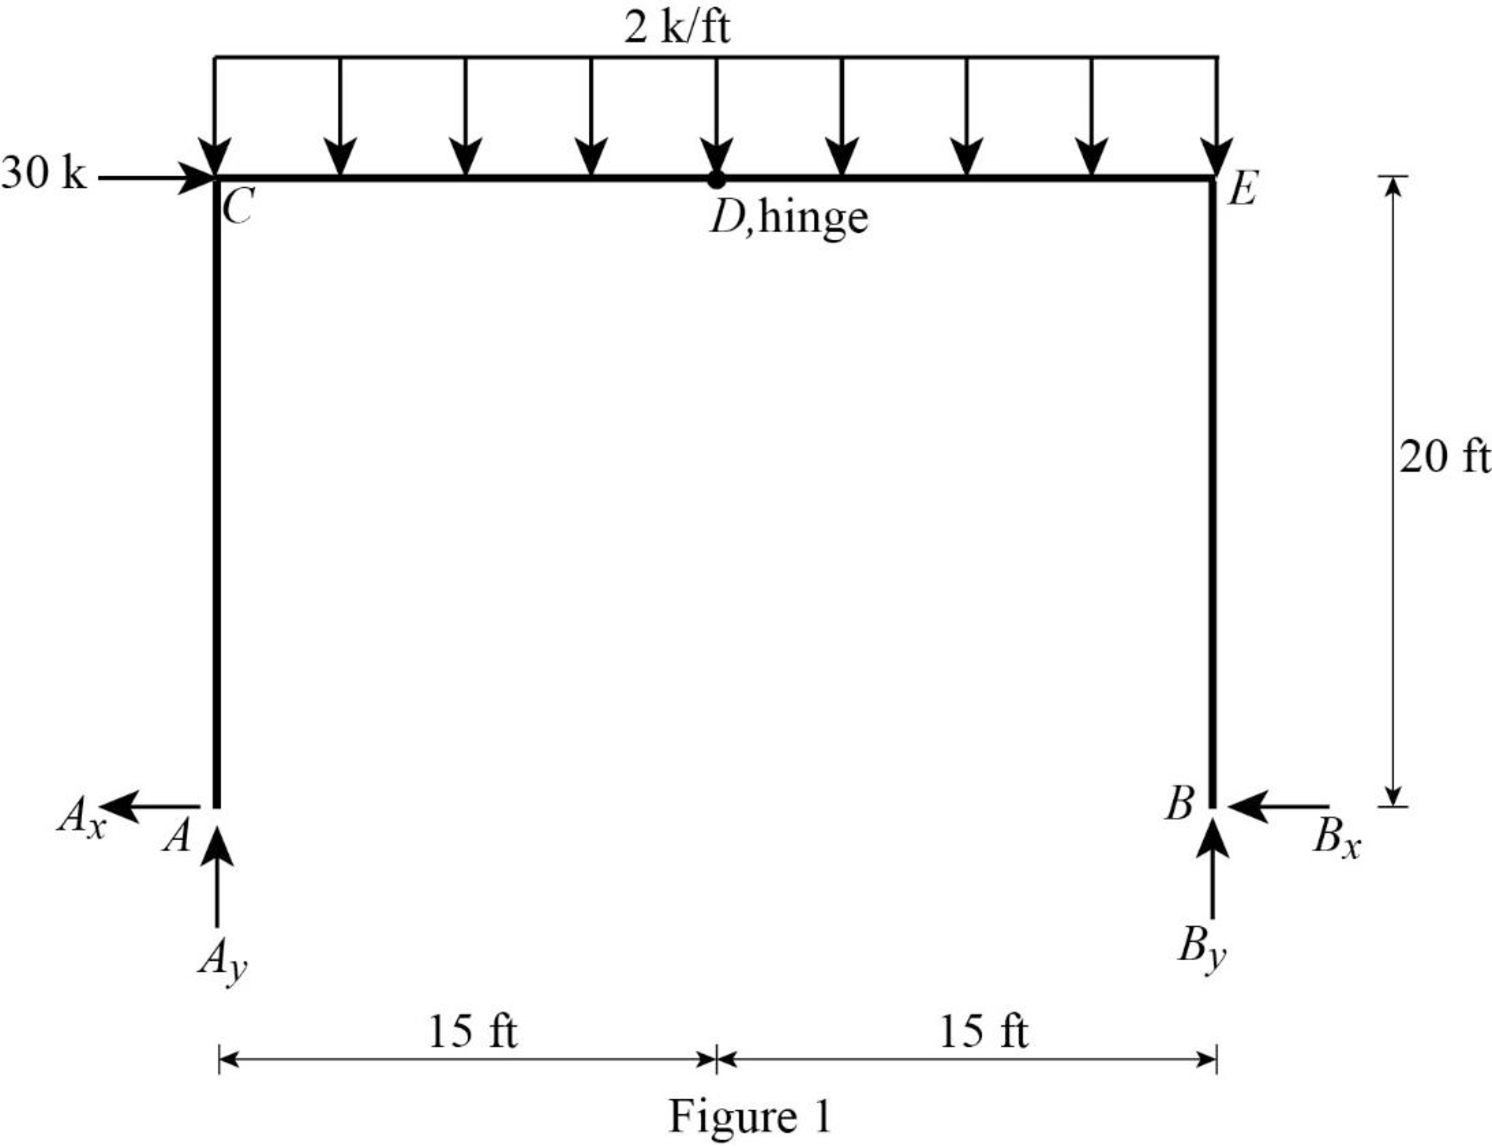
Refer Figure 1,
Consider entire frame.
Take moment about point A.
Find the vertical reaction at point A by resolving the vertical component of forces.
Find the horizontal reaction at point A by resolving the horizontal component of forces.
Consider the section DEB.
Find the horizontal reaction at point B by taking moment about the hinge at D.
Substitute 26.25 k for
Show the free-body diagram of the members and joints of the entire frame as in Figure 2.
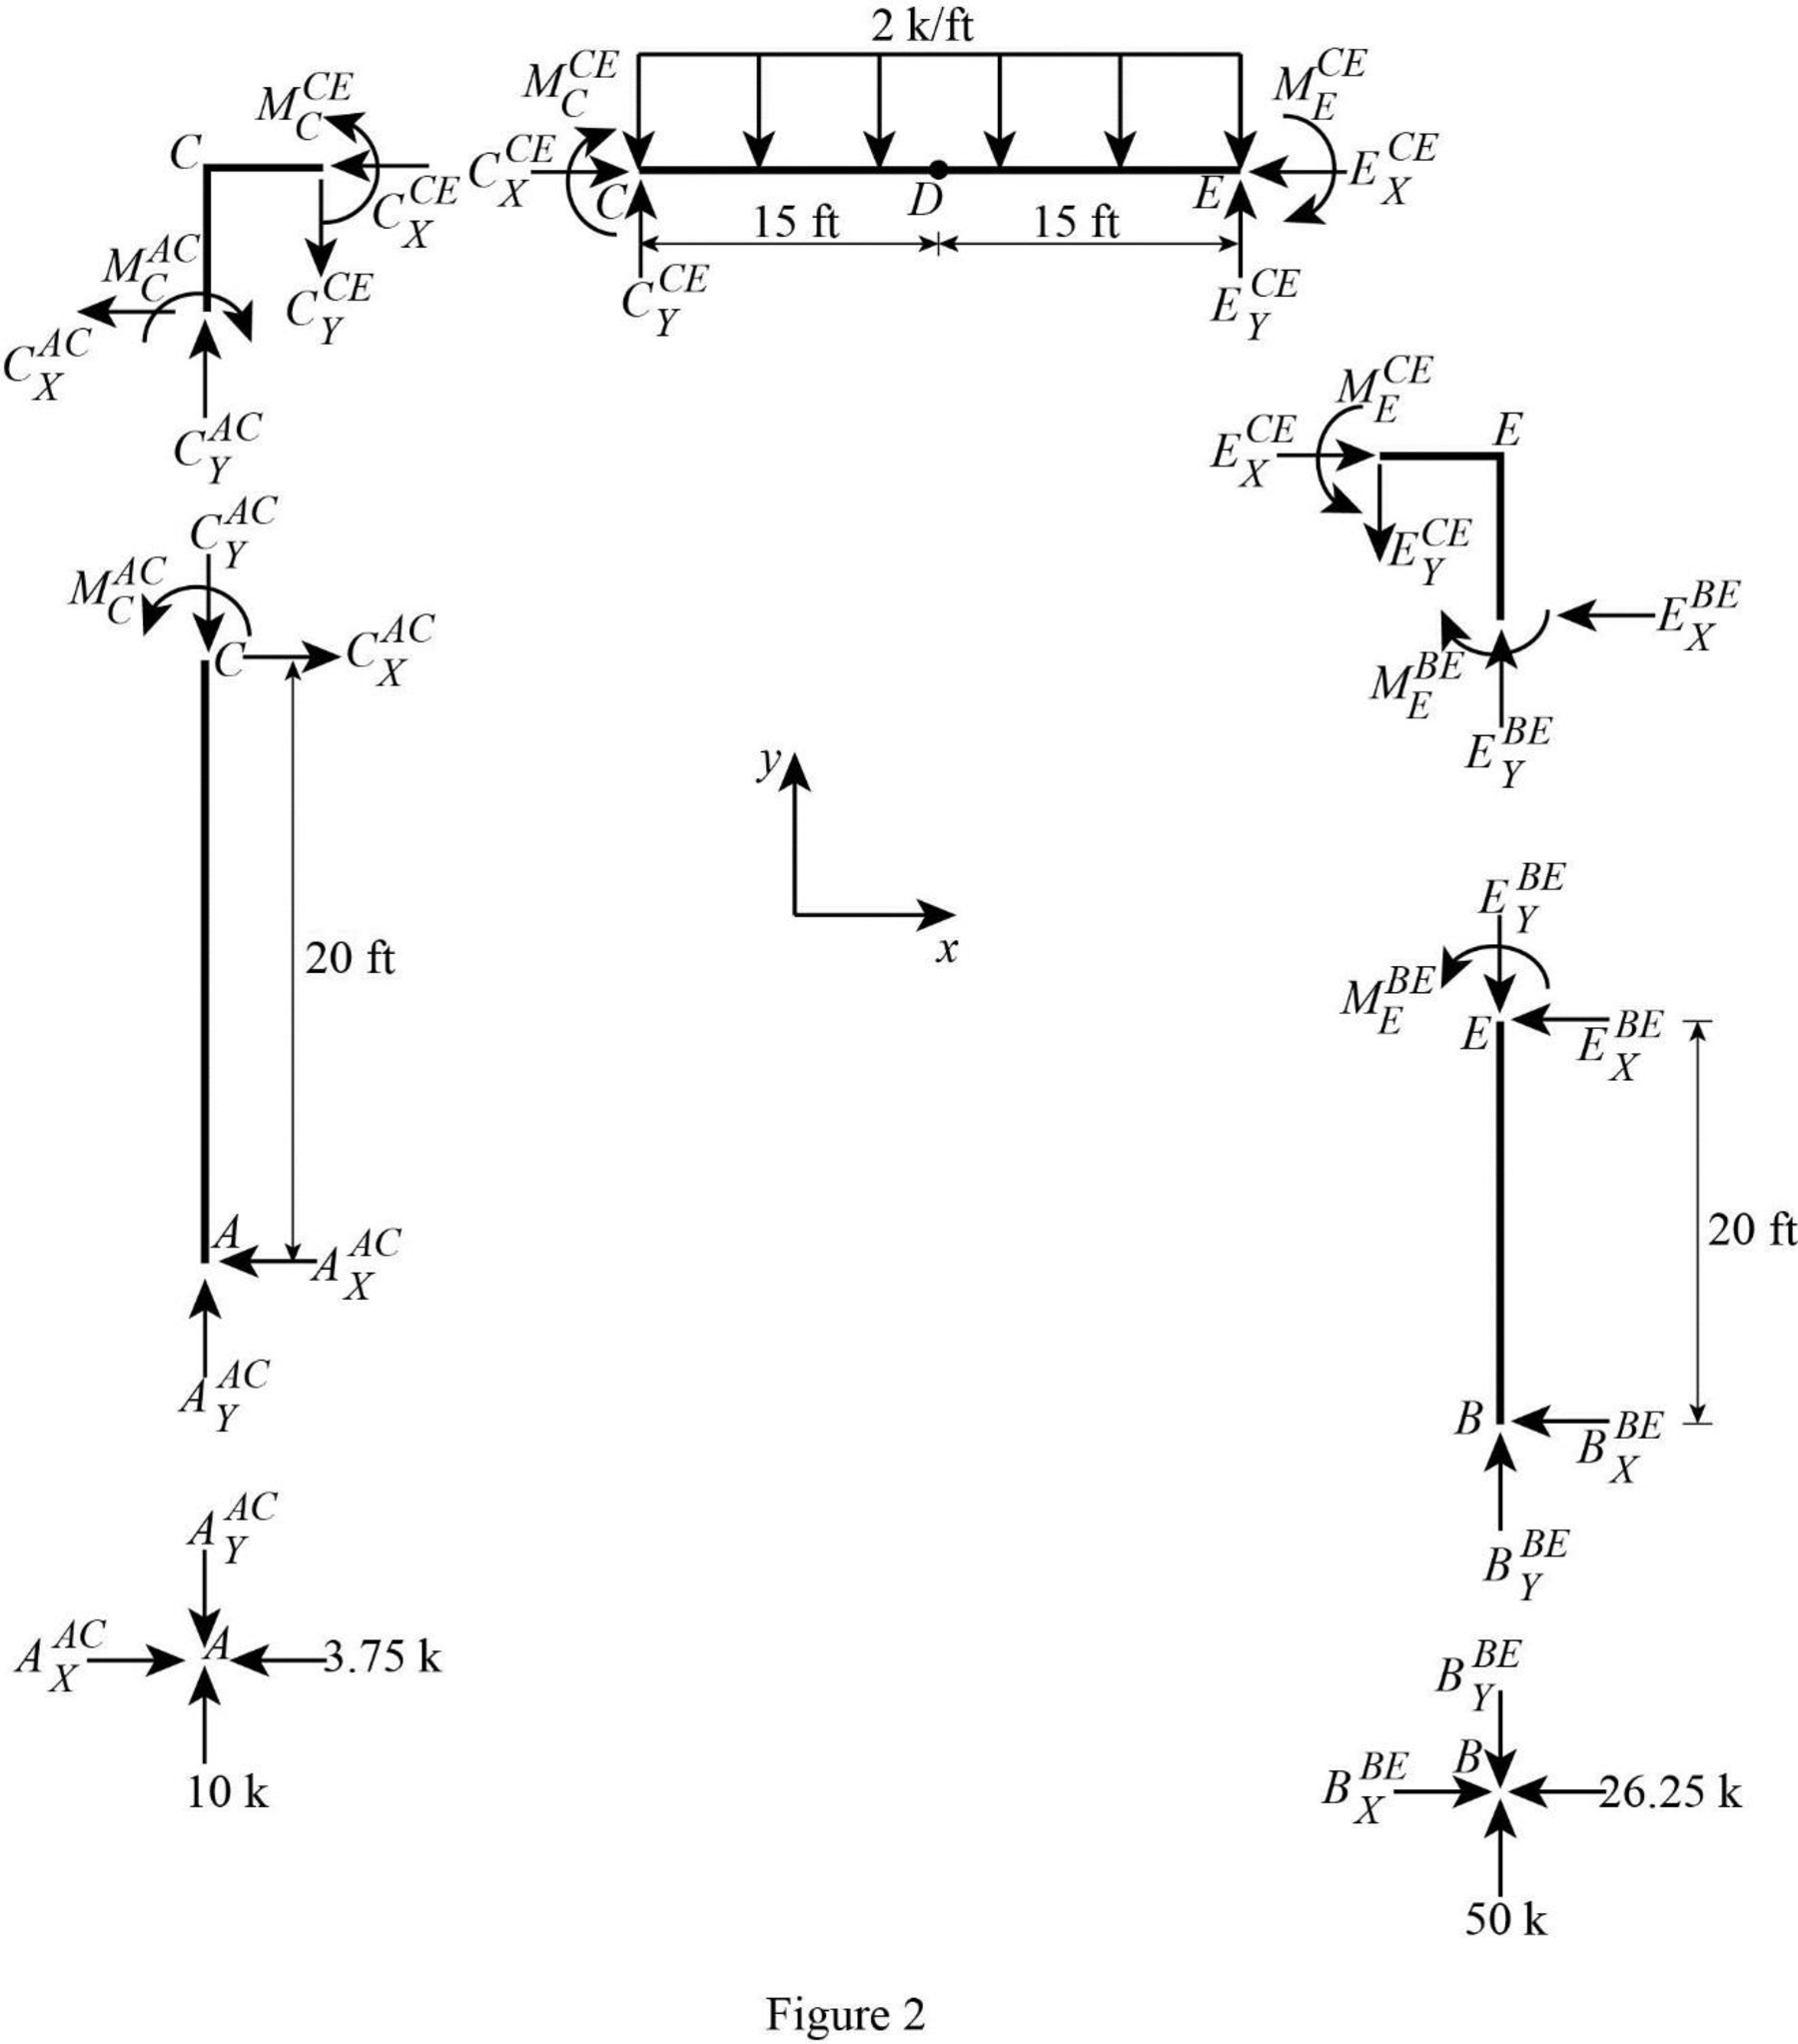
Consider point A:
Resolve the vertical component of forces.
Resolve the horizontal component of forces.
Consider the member AC:
Resolve the vertical component of forces.
Resolve the horizontal component of forces.
Take moment about the point C.
Consider the point C:
Resolve the vertical component of forces.
Resolve the horizontal component of forces.
Take moment about the point C.
Consider the member CDE:
Resolve the vertical component of forces.
Resolve the horizontal component of forces.
Take moment about the point E.
Consider the point E:
Resolve the vertical component of forces.
Resolve the horizontal component of forces.
Take moment about the point E.
Consider the point B:
Resolve the vertical component of forces.
Resolve the horizontal component of forces.
Plot the moment end forces of the frame as in Figure 3.
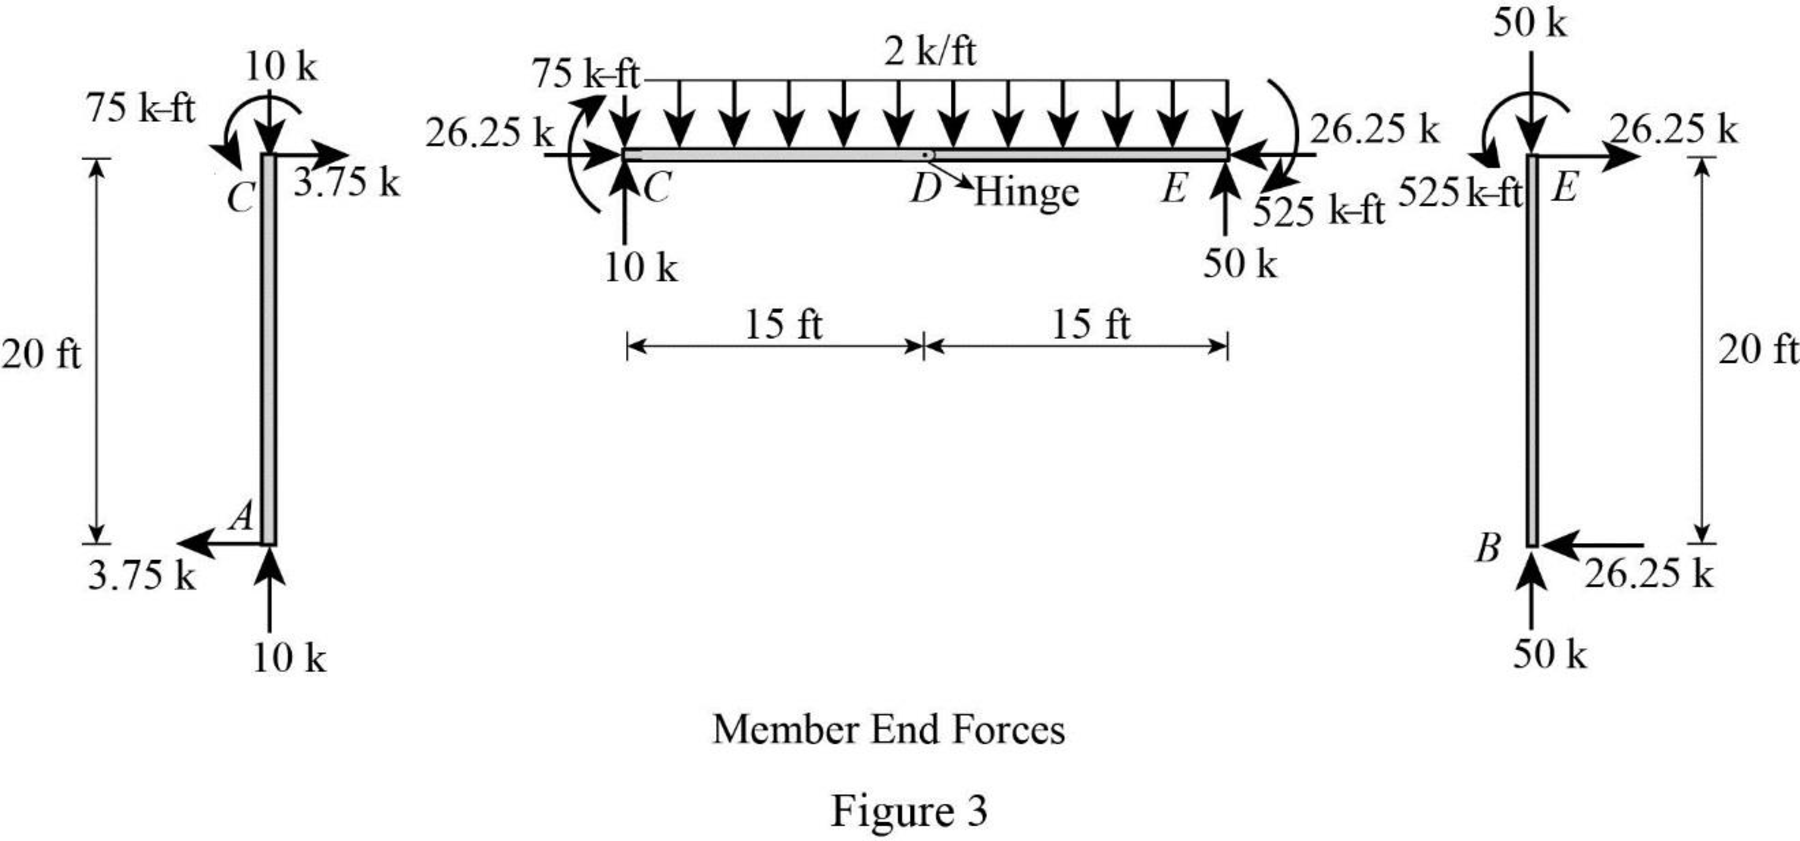
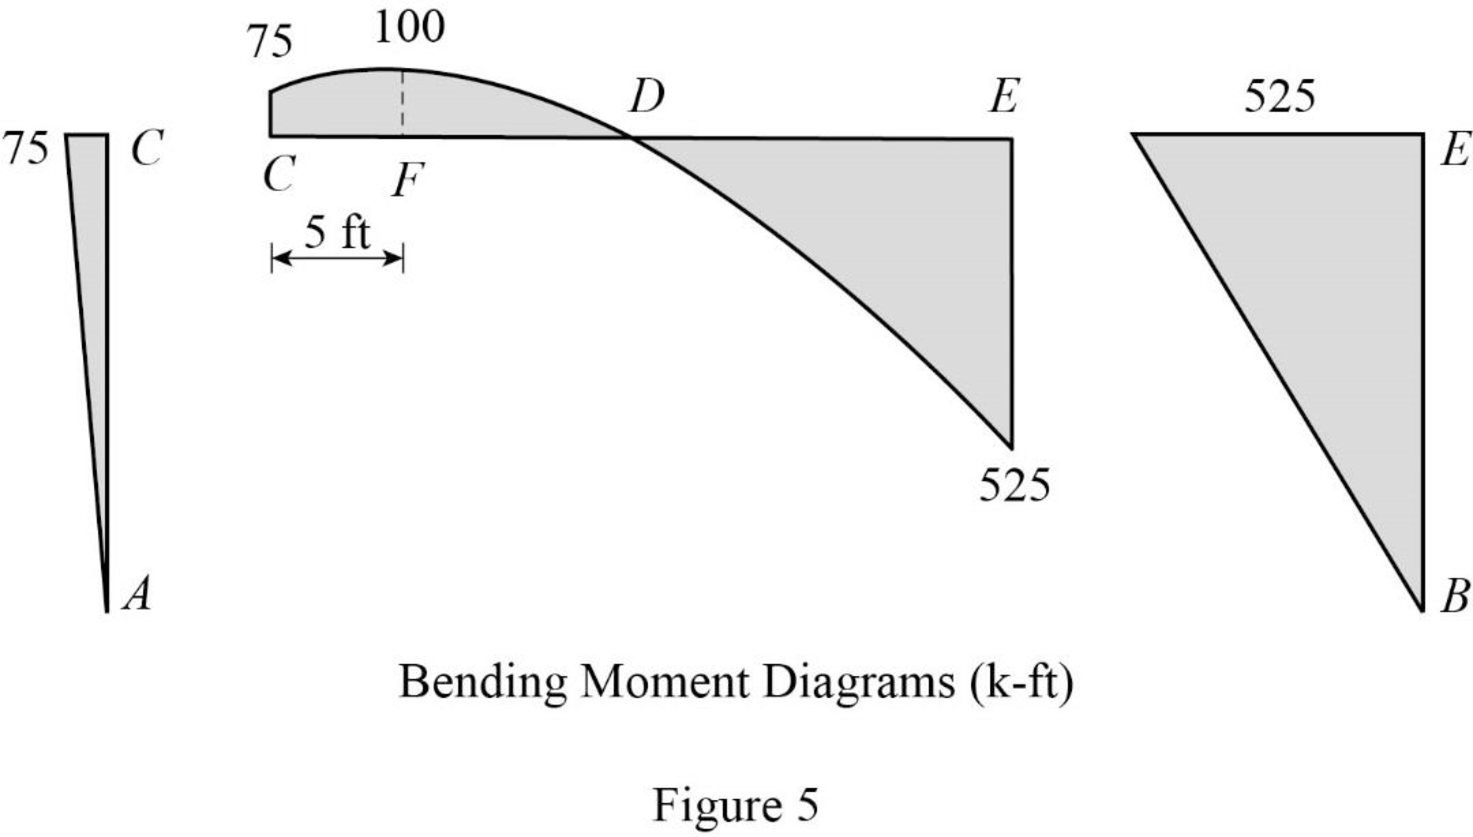
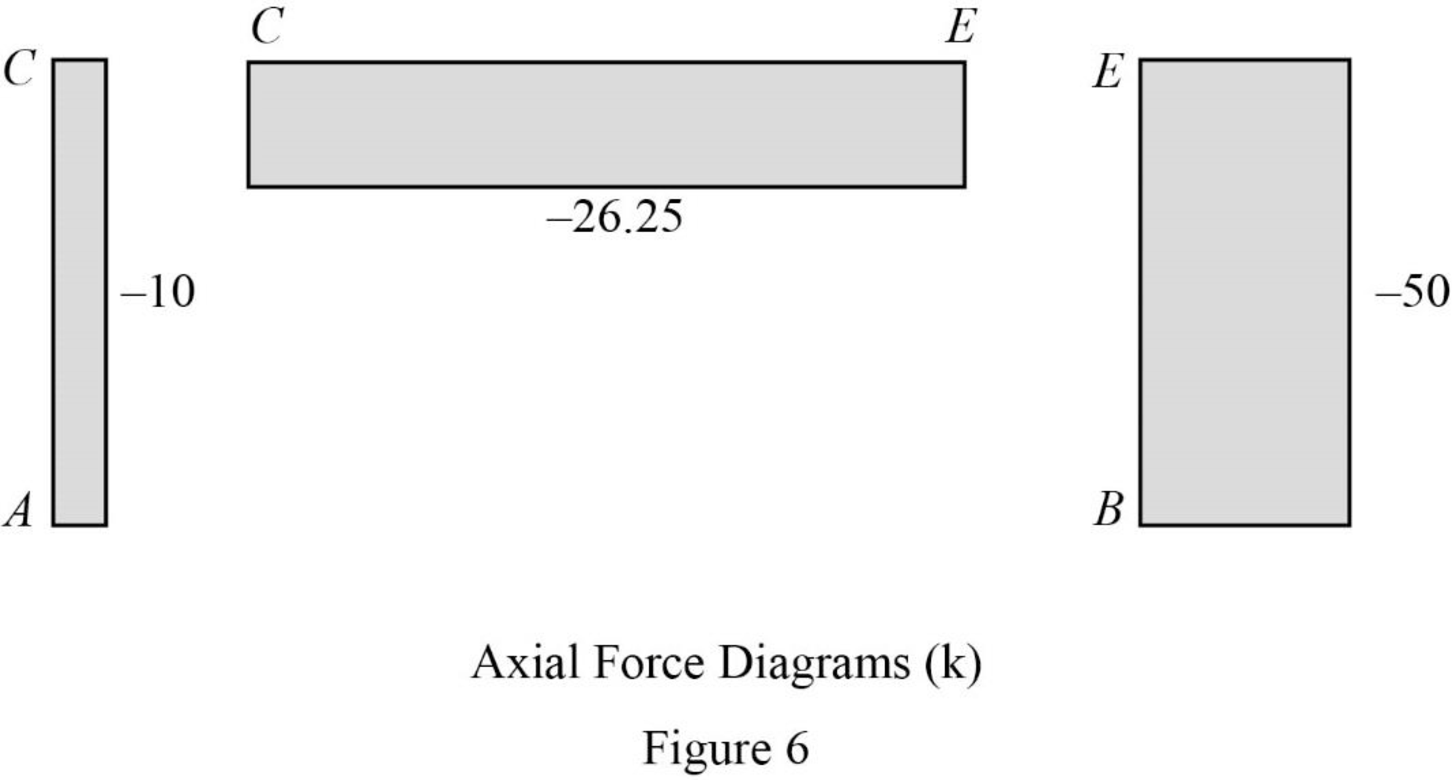
Refer to the moment end force diagram plot the shear diagram, bending moment diagram, and the axial force diagrams.
Plot the shear force diagram as in Figure 4.
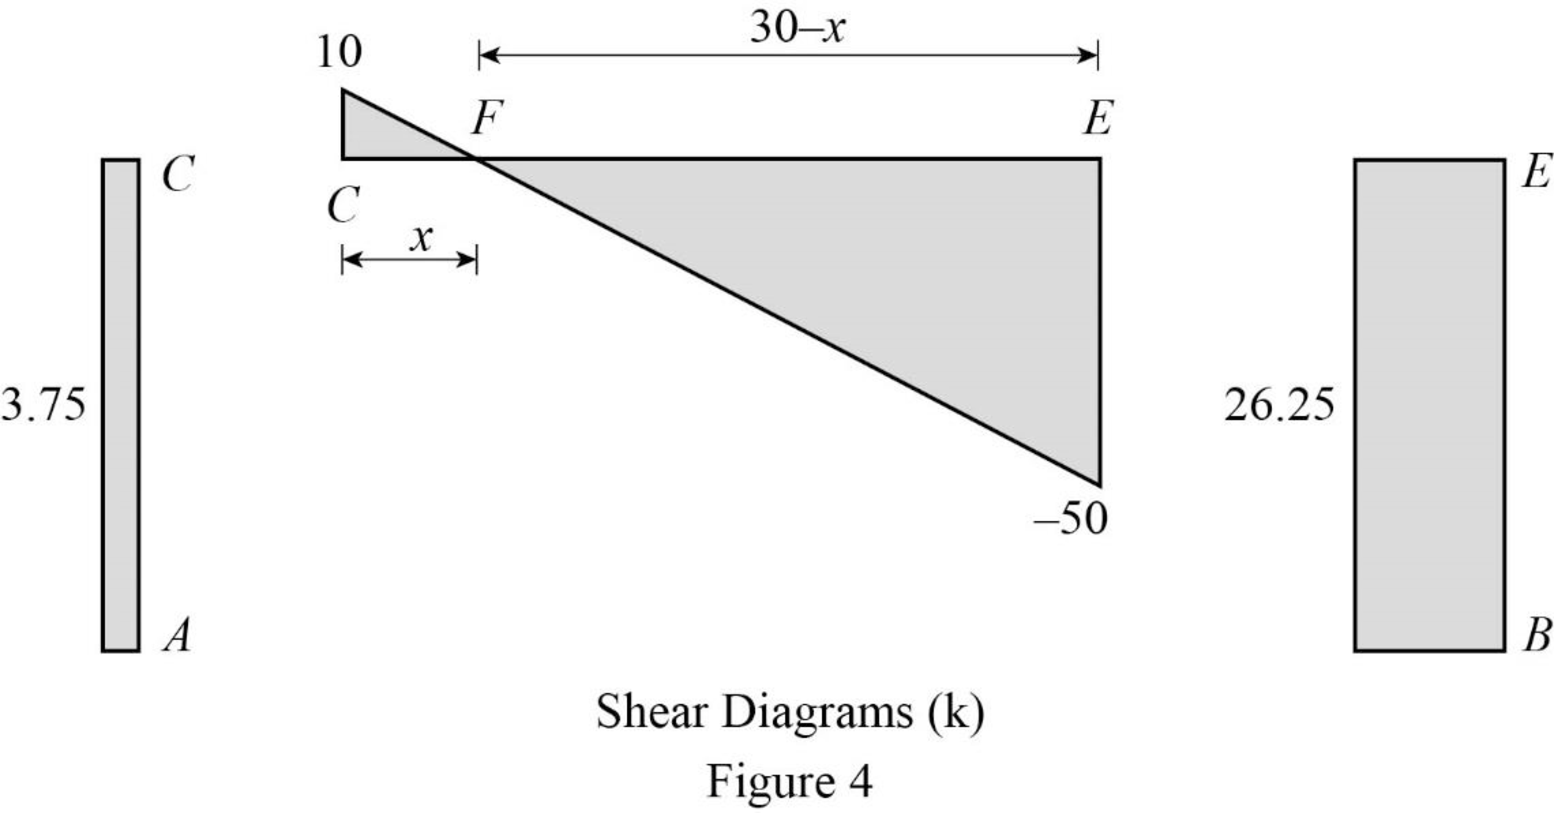
Refer to the shear force diagram, the maximum bending moment occurs at point F where the shear force changes sign.
Use similar triangle concept for the region CE:
Plot the bending moment diagram as in Figure 5.
Plot the axial force diagram as in Figure 6.
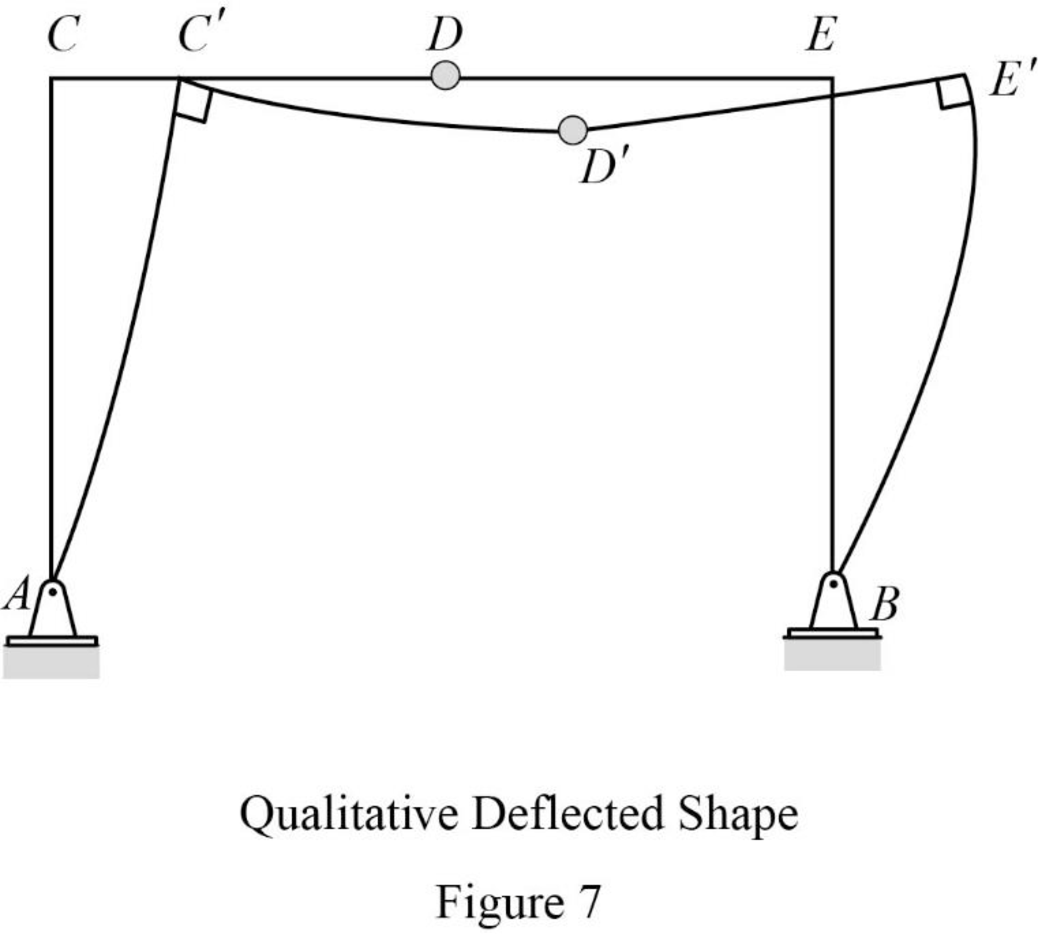
Plot the qualitative deflected shape as in Figure 7.
Want to see more full solutions like this?
Chapter 5 Solutions
EBK STRUCTURAL ANALYSIS


- 6. A lake with no outlet is fed by a river with a constant flow of 1200 ft3/s. Water evaporates from the surface at a constant rate of 13 ft3/s per square mile of surface area. The surface area varies with the depth h (in feet) as A (square miles) = 4.5 + 5.5h. What is the equilibrium depth of the lake? Below what river discharge (volume flow rate) will the lake dry up?arrow_forwardProblem 5 (A, B, C and D are fixed). Find the reactions at A and D 8 k B 15 ft A -20 ft C 10 ft Darrow_forwardProblem 4 (A, B, E, D and F are all pin connected and C is fixed) Find the reactions at A, D and F 8 m B 6m E 12 kN D F 4 marrow_forward
- Problem 1 (A, C and D are pins) Find the reactions and A, C and D. D 6 m B 12 kN/m 8 m A C 6 marrow_forwardUniform Grade of Pipe Station of Point A is 9+50.00. Elevation Point A = 250.75.Station of Point B is 13+75.00. Elevation Point B = 244.10 1) Calculate flowline of pipe elevations at every 50 ft. interval (Half Station). 2) Tabulate station and elevation for each station like shown on example 3) Draw Sketcharrow_forward40m 150N B 40marrow_forward
- Note: Please accurately answer it!. I'll give it a thumbs up or down based on the answer quality and precision. Question: What is the group name of Sample B in problem 3 from the image?. By also using the ASTM flow chart!. This unit is soil mechanics btwarrow_forwardPick the rural location of a project site in Victoria, and its catchment area-not bigger than 25 sqkm, and given the below information, determine the rainfall intensity for ARI = 5, 50, 100 year storm event. Show all the details of the procedure. Each student must propose different length of streams and elevations. Use fig below as a sample only. Pt. E-ht. 95.0 200m 600m PLD-M. 91.0 300m Pt. C-93.0 300m PL.B-ht. 92.0 PL.F-ht. 96.0 500m Pt. A-M. 91.00 To be deemed satisfactory the solution must include: Q.F1.1.Choice of catchment location Q.F1.2. A sketch displaying length of stream and elevation Q.F1.3. Catchment's IFD obtained from the Buro of Metheorology for specified ARI Q.F1.4.Calculation of the time of concentration-this must include a detailed determination of the equivalent slope. Q.F1.5.Use must be made of the Bransby-Williams method for the determination of the equivalent slope. Q.F1.6.The graphical display of the estimation of intensities for ARI 5,50, 100 must be shown.arrow_forwardQUANTITY SURVEYINGarrow_forward
