Concept explainers
Interpretation of Regression Results: Simple Regression Using a Spreadsheet
Hartman Company’s Lucas plant manufactures thermostatic controls. Plant management has experienced fluctuating monthly
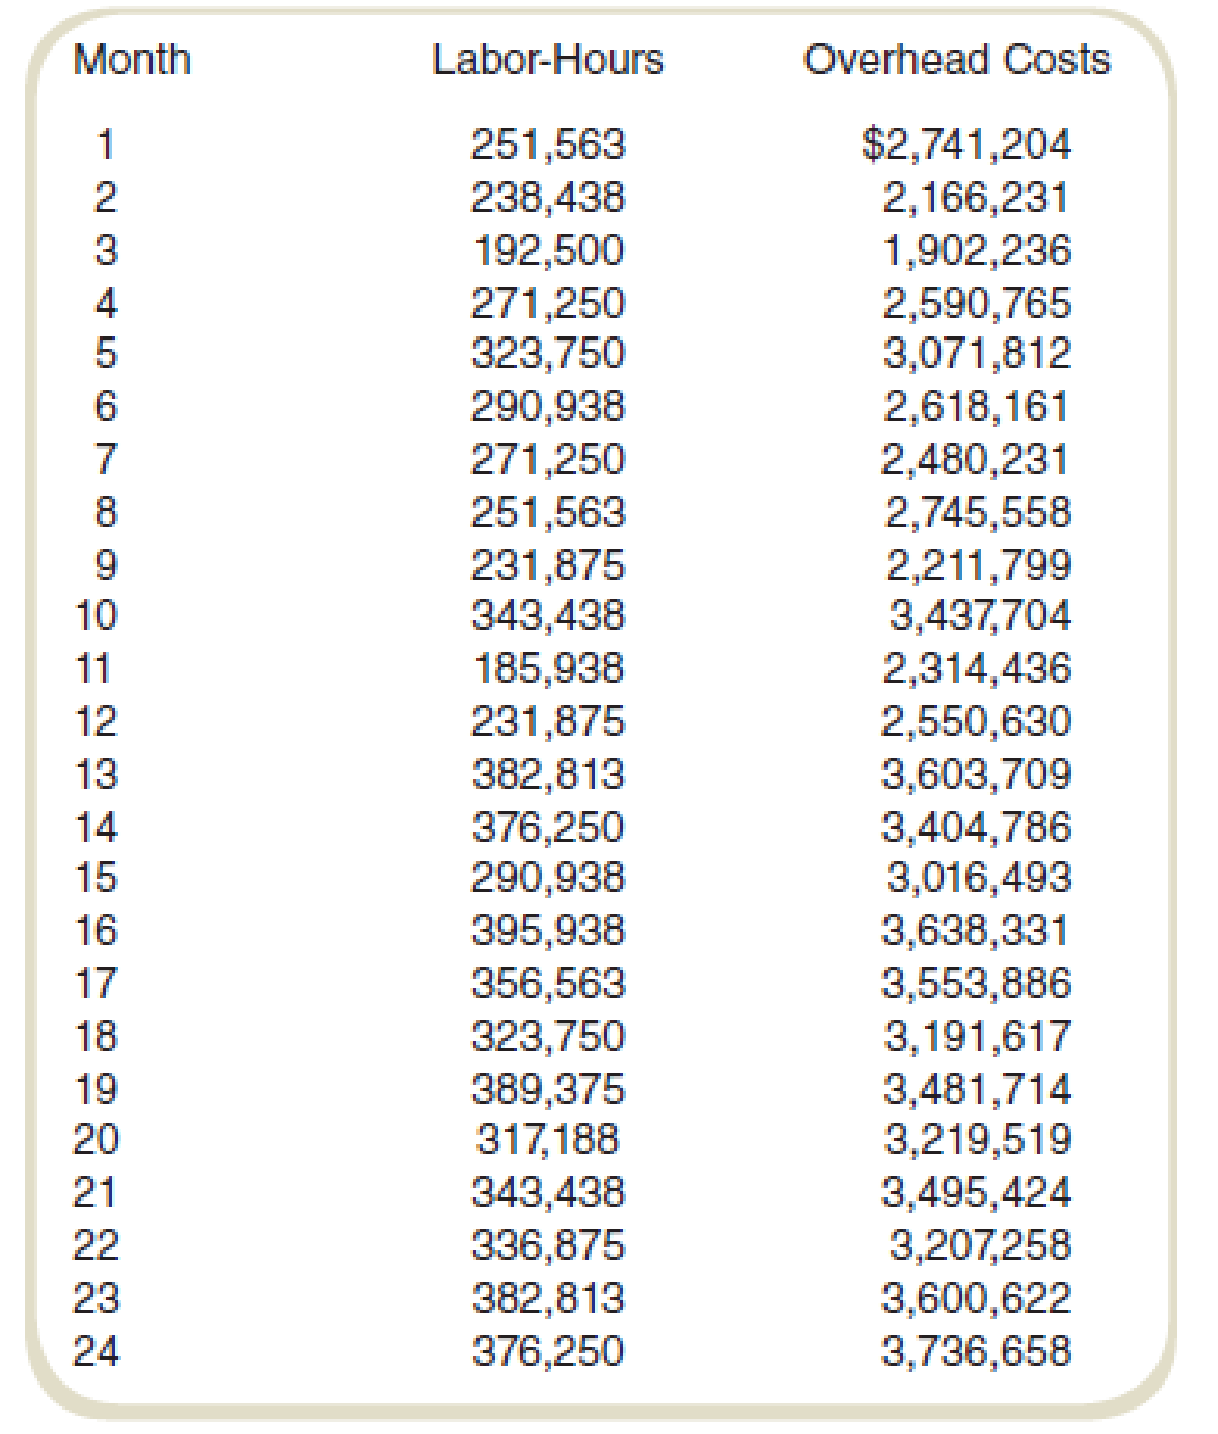
A member of the controller’s staff proposed that the behavior pattern of these overhead costs be determined to improve cost estimation. Another staff member suggested that a good starting place for determining cost behavior patterns is to analyze historical data. Following this suggestion, monthly data were gathered on labor-hours and overhead costs for the past two years. No major changes in operations occurred over this period of time. The data are shown in the following table:

Required
- a. Use the high-low estimation method to estimate the overhead cost behavior (fixed and variable portions components of cost) for the Lucas plant.
- b. Prepare a scattergraph showing the overhead costs plotted against the labor-hours.
- c. Use a spreadsheet program to compute regression coefficients to describe the overhead cost equation.
- d. Use the results of your regression analysis to develop an estimate of overhead costs assuming 350,000 labor-hours will be worked next month.
a.
Estimate the monthly fixed costs and the unit variable cost per machine-hour using the high-low estimation method.
Explanation of Solution
High-low cost method:
High-low cost method helps in separating the fixed and variable cost from the total cost. It is calculated by comparing the highest and lowest level of activities and the cost of these activities.
Show the cost equation of fixed and variable cost with the overhead cost:
Thus, the cost equation is
Working note 1:
Calculate the fixed cost:
Calculate the highest and lowest activity:
| Particular | Labor hours | Overhead costs |
| Highest activity | 395,938 | $3,638,331 |
| Lowest activity | 185,938 | $2,314,436 |
Table: (1)
Working note 2:
Calculate the variable cost (unit) with the help of high-low cost method:
Working note 3:
Calculate the variable cost ($) with the help of high-low cost method:
b.
Draw a scatter graph relating call center costs to the number of support calls.
Explanation of Solution
Scatter graph:
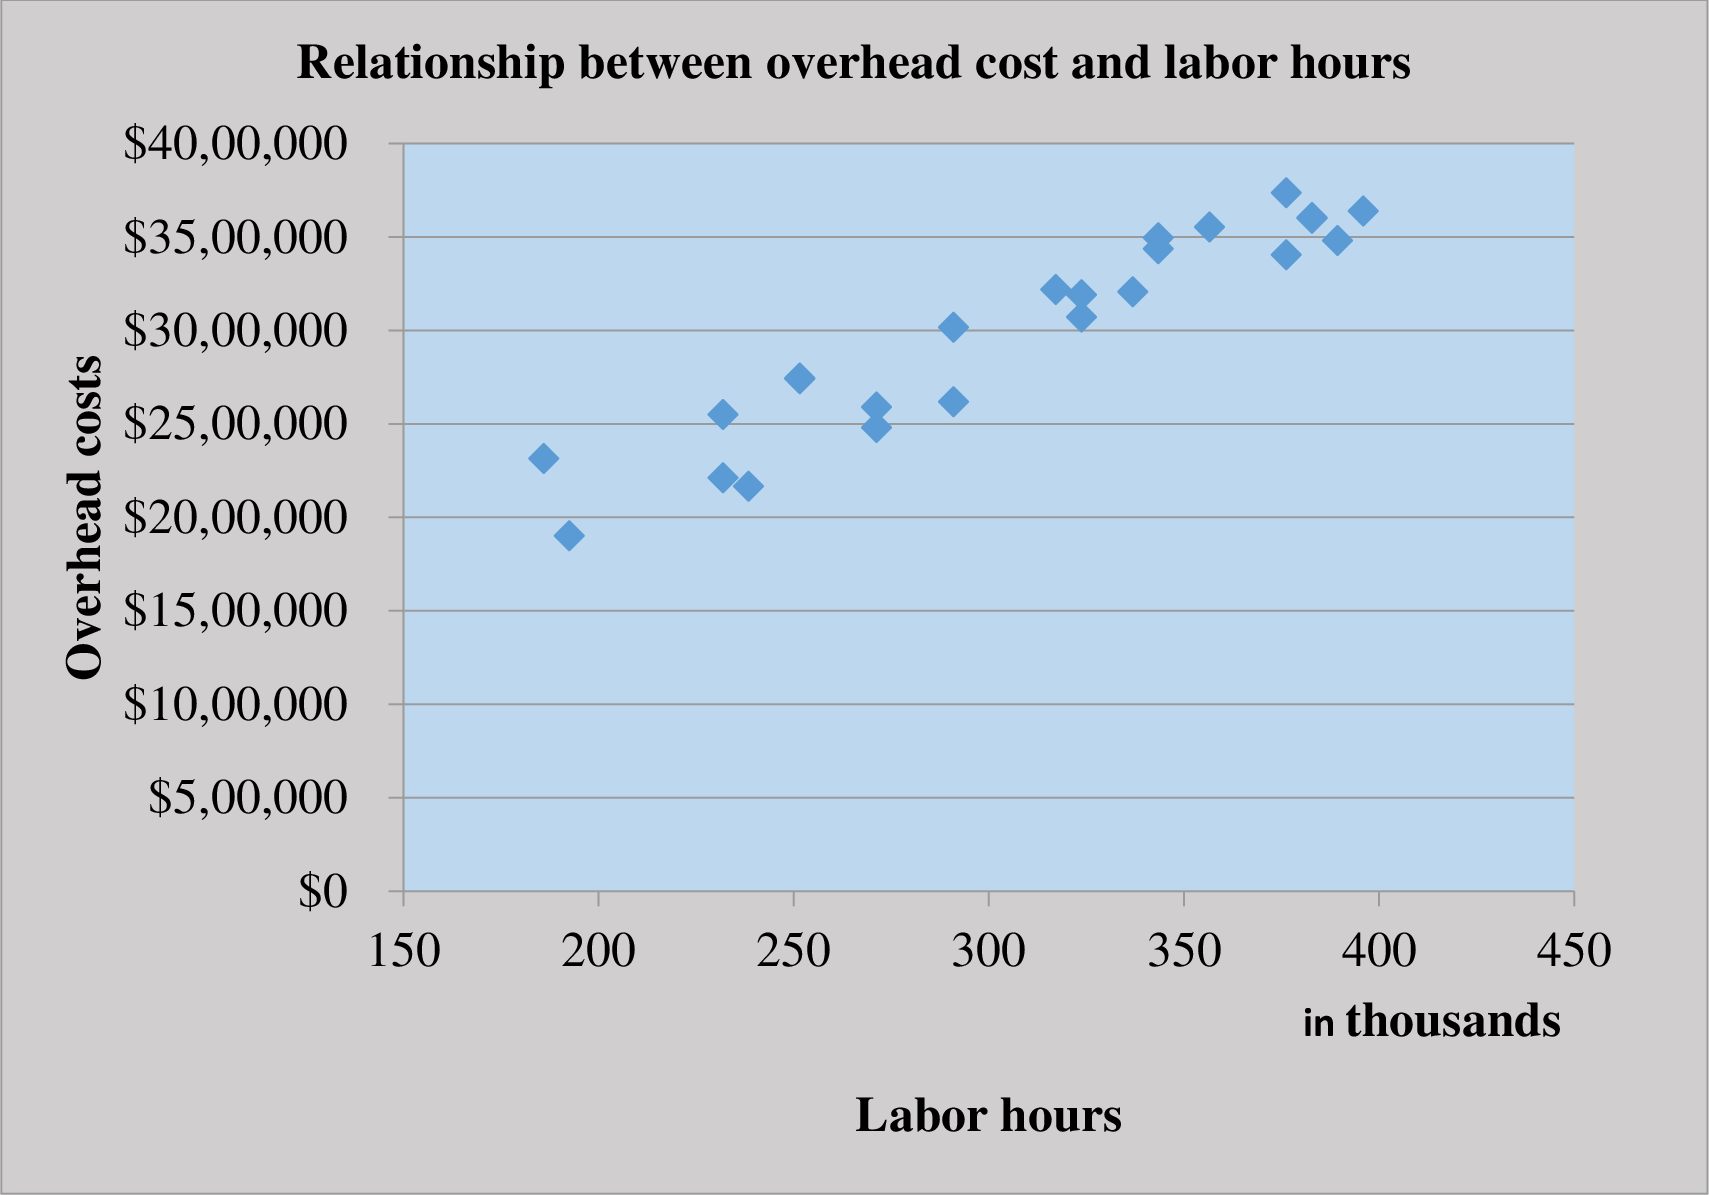
Scatter graph shows the relationship between the cost and the activity. It shows the cost at various level of activity. It helps in finding the outlier in the data. So the management can eliminate it to make more effective decisions
Prepare a scatter graph for overhead cost and labor hours:

The scatter plot represents labor hours on the horizontal axis and the overhead costs on the vertical axis.
c.
Use a spreadsheet program to compute regression coefficients to describe the overhead cost equation.
Explanation of Solution
Cost equation:
Cost equation is a mathematical representation of the cost estimation at various level of activity. It is used by defining the fixed cost, and variable cost per unit and then the variable cost per unit is multiplied by the given variable to calculate the relative cost.
Calculate the overhead cost equation with the help of regression coefficients:
| Regression Statistics | ||||||||
| Multiple R | 0.94878 | |||||||
| R Square | 0.900184 | |||||||
| Adjusted R Square | 0.895647 | |||||||
| Standard Error | 176381.9 | |||||||
| Observations | 24 | |||||||
| ANOVA | ||||||||
| df | SS | MS | F | Significance F | ||||
| Regression | 1 | 6.17E+12 | 6.17E+12 | 198.4054 | 1.73E-12 | |||
| Residual | 22 | 6.84E+11 | 3.11E+10 | |||||
| Total | 23 | 6.86E+12 | ||||||
| Coefficients | Standard Error | t Stat | P-value | Lower 95% | Upper 95% | Lower 95.0% | Upper 95.0% | |
| Intercept | 533857.1 | 178689.9 | 2.987618 | 0.006786 | 163277 | 904437.3 | 163277 | 904437.3 |
| X Variable 1 | 8.042909 | 0.571 | 14.08565 | 1.73E-12 | 6.858726 | 9.227091 | 6.858726 | 9.227091 |
Table: (2)
The regression analysis of the company provides the following details:
Calculate the cost equation:
Put the values in the cost equation:
Thus, the overhead cost is:
d.
Use the results of your regression analysis to develop an estimate of overhead costs assuming 350,000 labor-hours will be worked next month.
Answer to Problem 60P
The overhead cost is $3,347,857.
Explanation of Solution
Regression analysis:
Regression analysis is used to show the relationship between the cost and the activity. It is used to estimate the cost at various level of activity.
The most important step in the calculation of regression analysis is to establish a logical relationship between the cost and the activity. The activity (independent variable) is placed on the right-hand side, and the cost (dependent variable) is placed on the left-hand side of the graph.
Calculate the overhead cost:
Thus, the overhead cost is $3,347,857.
Want to see more full solutions like this?
Chapter 5 Solutions
FUNDAMENTALS OF COST ACCOUNTING
 Cornerstones of Cost Management (Cornerstones Ser...AccountingISBN:9781305970663Author:Don R. Hansen, Maryanne M. MowenPublisher:Cengage Learning
 Principles of Cost AccountingAccountingISBN:9781305087408Author:Edward J. Vanderbeck, Maria R. MitchellPublisher:Cengage Learning
 Managerial AccountingAccountingISBN:9781337912020Author:Carl Warren, Ph.d. Cma William B. TaylerPublisher:South-Western College Pub
 Financial And Managerial AccountingAccountingISBN:9781337902663Author:WARREN, Carl S.Publisher:Cengage Learning,
 Essentials of Business Analytics (MindTap Course ...StatisticsISBN:9781305627734Author:Jeffrey D. Camm, James J. Cochran, Michael J. Fry, Jeffrey W. Ohlmann, David R. AndersonPublisher:Cengage Learning
 Managerial Accounting: The Cornerstone of Busines...AccountingISBN:9781337115773Author:Maryanne M. Mowen, Don R. Hansen, Dan L. HeitgerPublisher:Cengage Learning


