Concept explainers
Videos
The U.S. Coast Guard (USCG) provides a wide variety of information on boating accidents including the wind condition at the time of the accident. The following table shows the results obtained for 4401 accidents (USCG website, November 8, 2012). 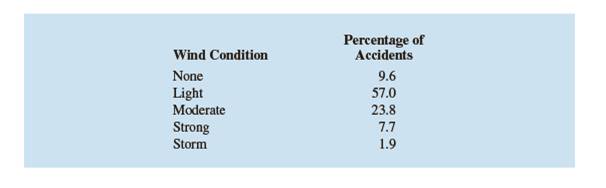
Let x be a random variable reflecting the known wind condition at the time of each accident.
Set
a. a
b. Compute the
c. Compute the variance and standard deviation for x.
d. Comment on what your results imply about the wind conditions during boating accidents.
a.
The probability distribution of x.
Answer to Problem 59SE
The probability distribution is:
| 0 | 0.096 |
| 1 | 0.57 |
| 2 | 0.238 |
| 3 | 0.077 |
| 4 | 0.019 |
Explanation of Solution
Given:
The results of wind condition at the time of 4401 accident are as given in the following table:
| Wind condition | Percentage of Accident |
| None | 9.6 |
| Light | 57 |
| Moderate | 23.8 |
| Strong | 7.7 |
| Strom | 1.9 |
Formula used:
The formulas are:
Calculation:
Consider,
Set
That is,
Thus, the required probability distribution of
|
|
|
| 0 | 0.096 |
| 1 | 0.57 |
| 2 | 0.238 |
| 3 | 0.077 |
| 4 | 0.019 |
b.
To find:The expected value of
Answer to Problem 59SE
The expected value of x is 1.353.
Explanation of Solution
Calculation:
The expected value of x can be computed as:
Hence, the expected value of x is 1.353.
c.
To find: The standard deviation and variance of x.
Answer to Problem 59SE
The variance and standard deviation of x are 0.68839 and 0.8296 respectively.
Explanation of Solution
Calculation:
The variance and standard deviation of x can be computed as:
Hence, the variance and standard deviation of x are 0.68839 and 0.8296 respectively.
d.
To explain: The wind condition during boating accidents.
Explanation of Solution
The wind condition during the boating accidents can be understood from the results obtained in part b and c. That is,
On an average the wind condition during the boating accidents is 1.353 and the dispersion or the variance in the wind condition is 0.68839.
In other words, the wind condition on an average is approximately 135.3% and variability of wind condition is nearly 68.839% during the boating accidents.
Want to see more full solutions like this?
Chapter 5 Solutions
Bundle: Essentials of Modern Business Statistics with Microsoft Office Excel, Loose-leaf Version, 7th + LMS Integrated for MindTap Business Statistics, 1 term (6 months) Printed Access Card


- 9. The concentration function of a random variable X is defined as Qx(h) = sup P(x ≤ X ≤x+h), h>0. Show that, if X and Y are independent random variables, then Qx+y (h) min{Qx(h). Qr (h)).arrow_forward10. Prove that, if (t)=1+0(12) as asf->> O is a characteristic function, then p = 1.arrow_forward9. The concentration function of a random variable X is defined as Qx(h) sup P(x ≤x≤x+h), h>0. (b) Is it true that Qx(ah) =aQx (h)?arrow_forward
- 3. Let X1, X2,..., X, be independent, Exp(1)-distributed random variables, and set V₁₁ = max Xk and W₁ = X₁+x+x+ Isk≤narrow_forward7. Consider the function (t)=(1+|t|)e, ER. (a) Prove that is a characteristic function. (b) Prove that the corresponding distribution is absolutely continuous. (c) Prove, departing from itself, that the distribution has finite mean and variance. (d) Prove, without computation, that the mean equals 0. (e) Compute the density.arrow_forward1. Show, by using characteristic, or moment generating functions, that if fx(x) = ½ex, -∞0 < x < ∞, then XY₁ - Y2, where Y₁ and Y2 are independent, exponentially distributed random variables.arrow_forward
- 1. Show, by using characteristic, or moment generating functions, that if 1 fx(x): x) = ½exarrow_forward1990) 02-02 50% mesob berceus +7 What's the probability of getting more than 1 head on 10 flips of a fair coin?arrow_forward9. The concentration function of a random variable X is defined as Qx(h) sup P(x≤x≤x+h), h>0. = x (a) Show that Qx+b(h) = Qx(h).arrow_forward
- Suppose that you buy a lottery ticket, and you have to pick six numbers from 1 through 50 (repetitions allowed). Which combination is more likely to win: 13, 48, 17, 22, 6, 39 or 1, 2, 3, 4, 5, 6? barrow_forward2 Make a histogram from this data set of test scores: 72, 79, 81, 80, 63, 62, 89, 99, 50, 78, 87, 97, 55, 69, 97, 87, 88, 99, 76, 78, 65, 77, 88, 90, and 81. Would a pie chart be appropriate for this data? ganizing Quantitative Data: Charts and Graphs 45arrow_forward10 Meteorologists use computer models to predict when and where a hurricane will hit shore. Suppose they predict that hurricane Stat has a 20 percent chance of hitting the East Coast. a. On what info are the meteorologists basing this prediction? b. Why is this prediction harder to make than your chance of getting a head on your next coin toss? U anoiaarrow_forward
 Glencoe Algebra 1, Student Edition, 9780079039897...AlgebraISBN:9780079039897Author:CarterPublisher:McGraw Hill
 Holt Mcdougal Larson Pre-algebra: Student Edition...AlgebraISBN:9780547587776Author:HOLT MCDOUGALPublisher:HOLT MCDOUGAL
 College Algebra (MindTap Course List)AlgebraISBN:9781305652231Author:R. David Gustafson, Jeff HughesPublisher:Cengage Learning
 Algebra & Trigonometry with Analytic GeometryAlgebraISBN:9781133382119Author:SwokowskiPublisher:Cengage