Concept explainers
Videos
Draw an entity-relationship diagram that shows the relationships among a
E-R model:
- It is a tool for creating data model.
- It is used for developers to describe the content of data model by using two functions called entities and relationships.
Entity:
- It helps the user for tracking something in database.
- Example entities in student database system are Student, Grade, Course, etc.
Relationships:
- Entities have relationships among each other.
- For example, in student database, a Student has a relationship to Major and Student has a relationship to Advisor.
Attribute:
- It used to describe the entity characteristics.
- Example attributes of student entity is Student_id, Student_name, Student_address, etc.
Identifier:
- It is an attribute or group of attribute, but its value is related with one and only one entity instance.
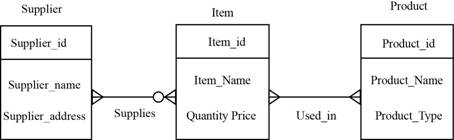
Example of E-R diagram:
Explanation of Solution
Entity Relationship diagram that displays relationship among the database, database application and users:
The below is the E-R diagram that shows the relationship that is laid among the database, database application and users:
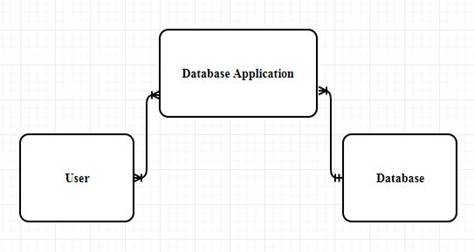
User:
The person or end user that can process the application that is stored in the database.
Database application:
A database application is a collection of four elements namely forms, reports, queries and application which acts as an intermediate between the user and data of the database
Database:
Database is a collection of information that is used to store and retrieve the data. Data is organized in tables.
Explanation of the E-R diagram:
- Many user can use the database application.
- Example of the user entity could be “students”, “faculty”.
- Many database applications can be present in a single database.
- Example of the database application could be “Bookstore”,”Library”.
- Only one database can contain many database application.
- Example of the database could be “studentDB”,”BookStoreDB”.
- The relationship between the user and the database application is “M:N (Many to many )relationship.
- The relationship between the database application and theDatbase is “N:1”(Many to One) relationship.
Want to see more full solutions like this?
Chapter 5 Solutions
Using MIS (10th Edition)


- Please solve and answer the questions correctly please. Thank you!!arrow_forwardConsidering the TM example of binary sum ( see attached)do the step-by-step of execution for the binary numbers 1101 and 11. Feel free to use the Formal Language Editor Tool to execute it; Write it down the current state of the tape (including the head position) and indicate the current state of the TM at each step.arrow_forwardI need help on inculding additonal code where I can can do the opposite code of MatLab, where the function of t that I enter becomes the result of F(t), in other words, turning the time-domain f(t) into the frequency-domain function F(s):arrow_forward
 Principles of Information Systems (MindTap Course...Computer ScienceISBN:9781285867168Author:Ralph Stair, George ReynoldsPublisher:Cengage Learning
 Principles of Information Systems (MindTap Course...Computer ScienceISBN:9781305971776Author:Ralph Stair, George ReynoldsPublisher:Cengage Learning
 Fundamentals of Information SystemsComputer ScienceISBN:9781305082168Author:Ralph Stair, George ReynoldsPublisher:Cengage Learning
 Fundamentals of Information SystemsComputer ScienceISBN:9781337097536Author:Ralph Stair, George ReynoldsPublisher:Cengage Learning
 A Guide to SQLComputer ScienceISBN:9781111527273Author:Philip J. PrattPublisher:Course Technology Ptr