
The elastic-rebound theory of faulting through a sketched map and the way it has been modified in recent years.
Answer to Problem 1QR
The elastic-rebound theory explains movement of faults by the rupture in rock through overpowering stress caused by Earth. The modification in this theory suggests that a considerable time is required to create another earthquake after a big earthquake.
Explanation of Solution
Pictorial representation: Fig.1 shows the elastic-rebound theory where (a) represents an active fault with a road, (b) represents occurrence of deformation along the fault, and (c) represents the final occurrence of deformation.
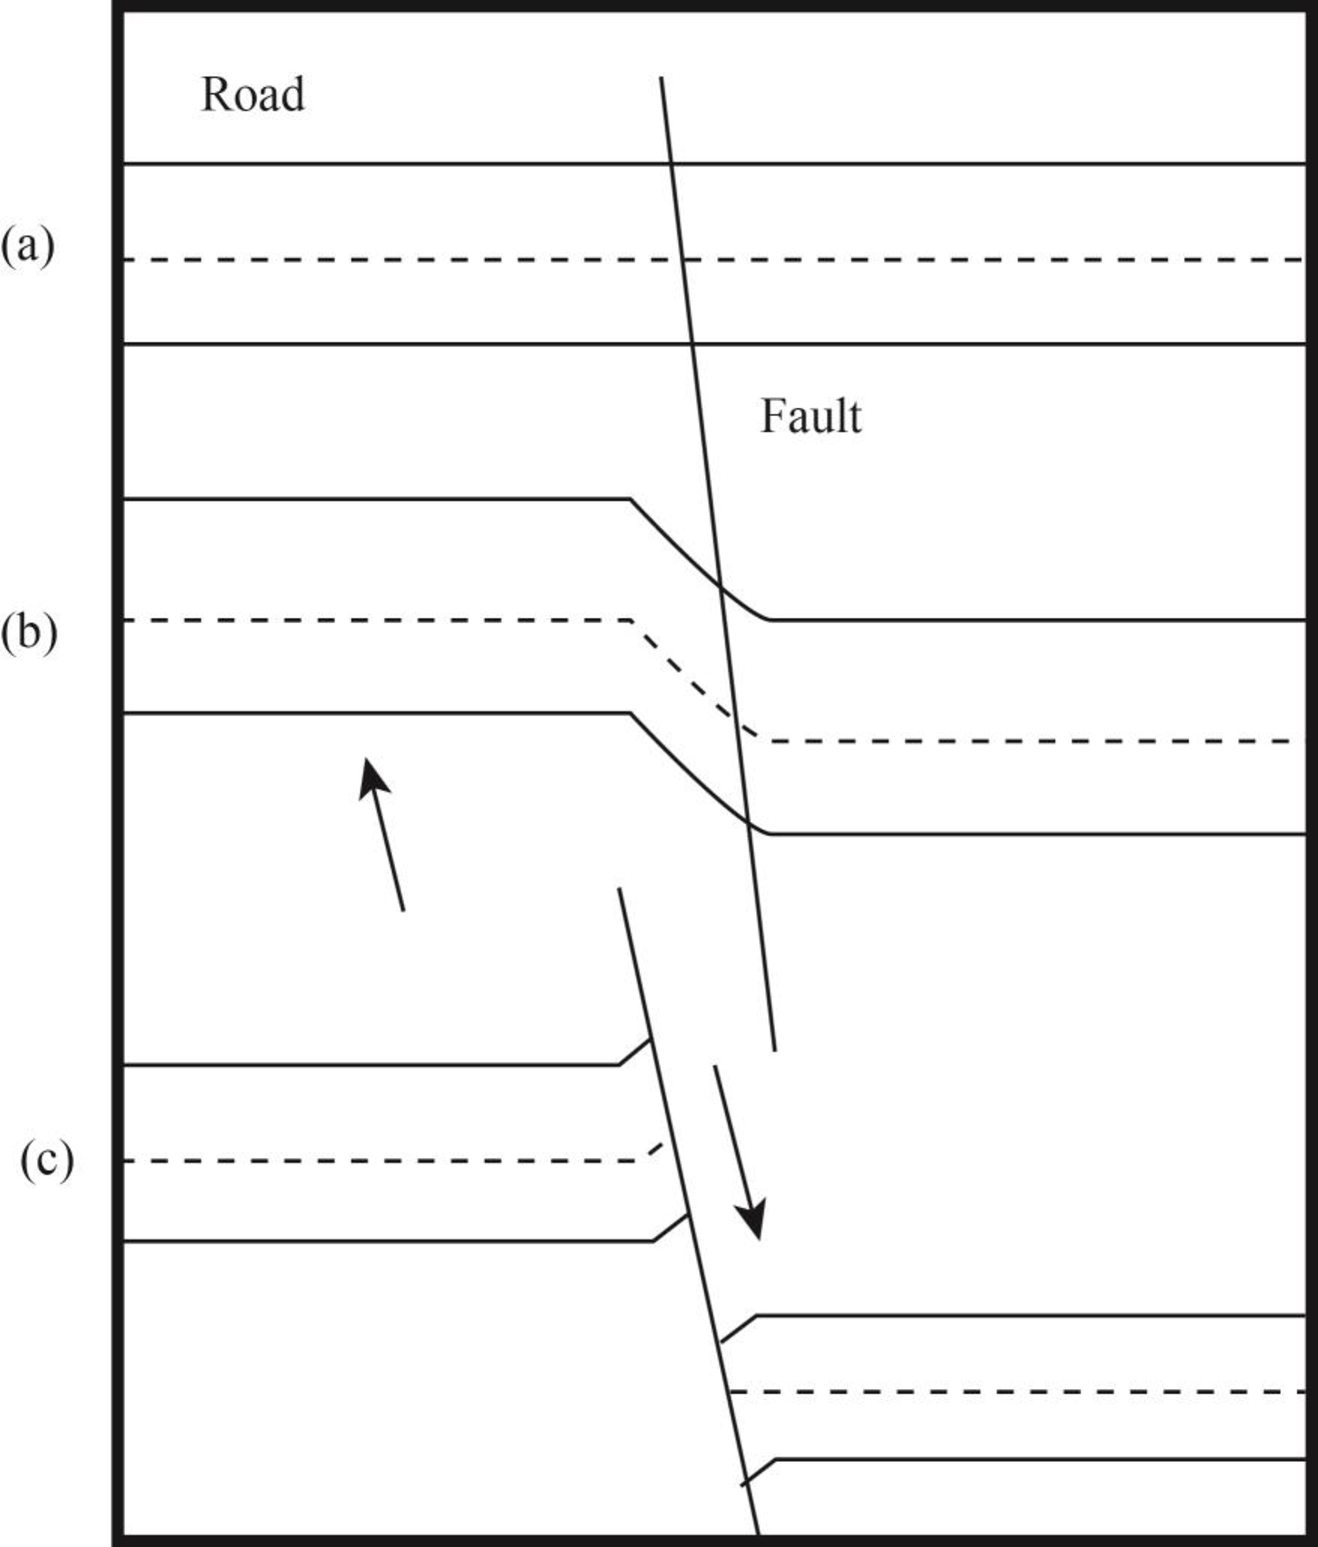
Fig.1 Schematic representation of elastic-rebound theory
After the San Francisco earthquake, the elastic-rebound theory was developed to explain movement of faults. According to seismic studies from San Andreas faults, the stress of Earth causes deformation and movement around both sides of a fault. However, rocks do not move due to this stress along the fault because of their roughness and irregularity. It results in the retardation of the movement of rocks with friction by making strong interlocking bonds. The land masses that are far from faults continue to move. The overpowering stress causes rupture in rocks at fault and both sides of fault move forward to catch or pass the rock which is away from fault. After this movement of fault, complete elastic strain is removed and new one is build up.
The former elastic bound theory still works but some modifications have emerged in recent years. These modifications suggest that most of the elastic strain is removed from the rocks after a large earthquake. A considerable time is needed to build a strain high enough to create another big earthquake.
Want to see more full solutions like this?
Chapter 5 Solutions
Natural Disasters

- Please write the final report in detail with all the components.arrow_forwardProvide two paragraphs on your thoughts of reforestation. Please write in first person.arrow_forward1. Label the zone of saturation, the unsaturated zone, and the water table.2. Describe the shape of the water table in relationship to the shape of the land surface.3. Whenever a substantial amount of water is withdrawn from a well, the water table forms a cone of depression. Label the cone of depression on Figure 8.13. What factors might cause a cone of depression to become larger or smaller?4. Use a pencil to shade the area between the dashed lines labeled A. This zone represents an impermeable lens of clay. Describe what will happen to water that infiltrates to the depth of the clay lens at point A.5. How does the drop in the water table during a drought affect the operation of the well? The blue dashed line in Figure 8.13 represents the level of the water table during a drought.arrow_forward
- PlEaSe HeLp As SoOn As PoSsIbLe Identify and label examples of a point bar, a cutbank, and an oxbow lake on the stereogram in Figure 8.11.arrow_forwardWhich of the following is NOT a natural reservoir for water? trees, lakes, creeks, rivers, atmospherearrow_forward1. Draw an arrow on the map to indicate the direction that the main river, the Genesee, is flowing. (Hint: Use the elevations of the two bench marks [BM] next to the river near the top and bottom of the map to determine your answer.) 2. Use the BM elevations from Question 1 to calculate the approximate gradient of the Genesee River. 3. Use Figure 8.9 to draw a profile along line A-A". Use only index contour lines. 4. Approximately how many feet is the Genesee River above sea level? 5. The path of the Genesee River can best be described as which of the following: a straight course or a meandering course? 6. Which phrase most accurately describes most of the areas beyond the Genesee River Valley: very broad and flat or relatively hilly and dissected? 7. Use the fractional scales on the Angelica topographic map and the Portage, Montana, map (page 136) to answer the following. a. What is the fractional scale for the Angelica map? b. How does this compare to the fractional scale for the…arrow_forward
- 1. Compare the stereogram in Figure 8.7 to the map in Figure 8.6. Then, on the topographic map, outline the area shown in the photo. 2. Is the terrain in Section 14, located on the west side of this map, relatively flat or hilly? Explain. 3. Label the areas that topographically resemble Section 14 on the topographic map as "upland." 4. Describe the topography in the lower half of Section 17, located three sections east of section 14. 5. Section 17 contains a portion of the valley occupied by the Missouri River. Approximately what percentage of the area shown on the map is stream valley (similar to the lower half of Section 17) and what percentage is upland? 6. Which of the following best describes the shape of the Missouri River Valley along the line labeled D.-D': wide valley with a floodplain or steep-sided V-shaped valley with no floodplain?arrow_forwardUse the Portage, Montana, topographic map in Figure 8.6 (on page 136) and the stereogram in Figure 8.7 (on page 137) to complete the following. 1. Compare the stereogram in Figure 8.7 to the map in Figure 8.6. Then, on the topographic map, outline the area shown in the photo. 2. Is the terrain in Section 14, located on the west side of this map, relatively flat or hilly? Explain. 3. Label the areas that topographically resemble Section 14 on the topographic map as "upland." 4. Describe the topography in the lower half of Section 17, located three sections east of section 14. 5. Section 17 contains a portion of the valley occupied by the Missouri River. Approximately what percentage of the area shown on the map is stream valley (similar to the lower half of Section 17) and what percentage is upland? 6. Which of the following best describes the shape of the Missouri River Valley along the line labeled D.-D': wide valley with a floodplain or steep-sided V-shaped valley with no floodplain?…arrow_forwardPlease upload your one to two-page summary about what you learned from the 55-minute Magnetic Storm documentary. H) The Universe Magnetic Storm Threat.... Η The Liver MWgnete storm Threat. Watch later Share HISTORY H Watch on YouTubearrow_forward
- Use the textbook and the internet to complete the following work covering all of the previous material. It will help with a deeper understanding of the material before taking Midterm #1 too. Choose the best bold word/s option for each one given below. Please write out in complete sentences your answers and upload your file. 1. The Earth is a/an open or closed system as far as energy is concerned and a/an open or closed as far as "rocky" material (10 points). 2. Divergent boundaries experience tensional, compressional, or shearing forces creating normal, reverse, or strike-slip faults (10 points). 3. Convergent experience tensional, compressional, or shearing forces creating normal, reverse, or strike-slip faults (10 points). 4. Transform boundaries experience tensional, compressional, or shearing forces creating normal, reverse, or strike-slip faults (10 points). 5. The Himalayas an example of a convergent, divergent, or transform boundary (5 points). 6. The Mid-Atlantic Ridge an…arrow_forwardDiscussion Question: Solar Energy, Seasons, and the Atmospherearrow_forward1. Does urbanization increase or decrease the peak streamflow? 2. What is the effect of urbanization on lag time (the span between when rainfall occurred and when peak stream discharge occurred)? 3. Does total runoff occur over a longer or shorter time span after an area has been urbanized? 4. Based on what you have learned from the hydrographs in Figure 8.4, explain why urban areas often experience more flash-flooding than do rural areas during intense rainfalls.arrow_forward
 Applications and Investigations in Earth Science ...Earth ScienceISBN:9780134746241Author:Edward J. Tarbuck, Frederick K. Lutgens, Dennis G. TasaPublisher:PEARSON
 Exercises for Weather & Climate (9th Edition)Earth ScienceISBN:9780134041360Author:Greg CarbonePublisher:PEARSON
 Environmental ScienceEarth ScienceISBN:9781260153125Author:William P Cunningham Prof., Mary Ann Cunningham ProfessorPublisher:McGraw-Hill Education
 Earth Science (15th Edition)Earth ScienceISBN:9780134543536Author:Edward J. Tarbuck, Frederick K. Lutgens, Dennis G. TasaPublisher:PEARSON
 Environmental Science (MindTap Course List)Earth ScienceISBN:9781337569613Author:G. Tyler Miller, Scott SpoolmanPublisher:Cengage Learning
 Physical GeologyEarth ScienceISBN:9781259916823Author:Plummer, Charles C., CARLSON, Diane H., Hammersley, LisaPublisher:Mcgraw-hill Education,