Concept explainers
Videos
To analyze:
The result and describe the pathway that is followed by the protein by plotting a fluorescence intensity versus time graph with the help of the given table.
Given:
The green fluorescent protein (GFP) gene is fused with the gene of the viral protein. The normal cell is infected and the movement of the protein is monitored using fluorescence imaging equipment. The table shown below summarizes the result of the experiment:
| Relative fluorescence intensity | ||||
| Time (minutes) | Endoplasmic reticulum (ER) | Golgi | Cell membrane | Total |
| 0 | 0.95 | 0.05 | 0.00 | 1.00 |
| 20 | 0.64 | 0.28 | 0.08 | 1.00 |
| 40 | 0.38 | 0.39 | 0.23 | 1.00 |
| 60 | 0.17 | 0.38 | 0.44 | 0.99 |
| 80 | 0.05 | 0.28 | 0.65 | 0.98 |
| 100 | 0.00 | 0.25 | 0.70 | 0.95 |
| 150 | 0.00 | 0.05 | 0.77 | 0.82 |
| 200 | 0.00 | 0.00 | 0.75 | 0.75 |
Introduction:
The GFP is a protein that fluoresces and is obtained from the aquatic animal called jellyfish, having the scientific name Aequorea victoria. It is made up of 238 amino acids. It emits green fluorescent light in the presence of ultraviolet light. GFP is used widely in biological techniques. For example, GFP gene is fused with the gene of the viral protein. The normal cell is then infected and the movement of the protein is monitored using fluorescence imaging equipment. This method is used to track the pathway that is traced by the protein.
Explanation of Solution
The graph of fluorescence intensity against time for the protein that is present in the ER is given below:
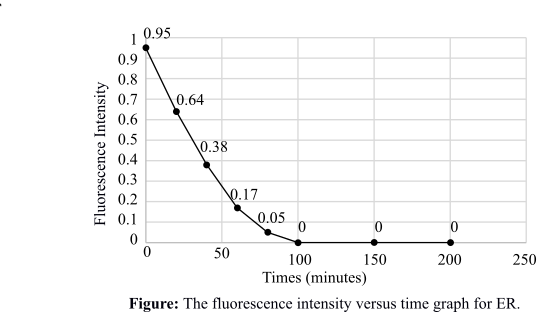
This graph depicts the intensity of fluorescence against time for the protein that is present in the ER. Initially, the fluorescence intensity is high, which means that the protein is entering the ER directly after synthesis. The graph plot is gradually decreasing, which is showing that the fluorescence in the ER is decreasing and reaching zero. This means that the fluorescent protein has moved out of the ER.
The graph of fluorescence intensity against time for the protein that is present in the Golgi apparatus is given below:
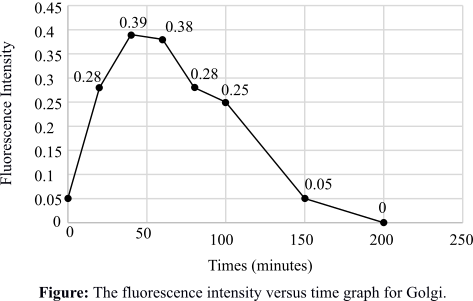
This graph depicts the intensity of fluorescence against time for the protein that is present in the Golgi apparatus. Initially, the fluorescence intensity is increasing, which means that the protein is entering the Golgi after a considerable time. The graph plot is gradually decreasing, which is showing that the fluorescence in the Golgi is decreasing and reaching zero. This means that the fluorescent protein is also moving out of the Golgi.
The graph of fluorescence intensity against time for the protein that is present in the cell membrane is given below:
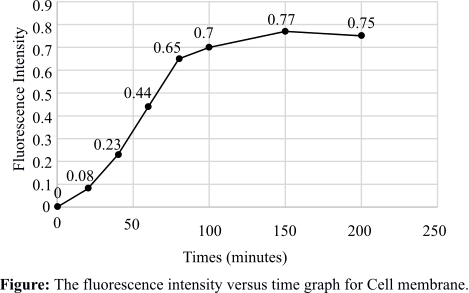
This graph depicts the intensity of fluorescence against time for the protein that is present in the cell membrane. The fluorescence intensity is increasing gradually and is maximized after some time, which means that the protein is embedded in the cell membrane.
The pathway that is followed by the protein is traced with the help of the graphs drawn. The protein enters the ER quickly after synthesis and then goes to the Golgi. From the Golgi, it moves to the cell membrane to form virus particles.
Therefore, the graphs are plotted and the pathway of the GFP fusion protein is traced with the help of the graphs. The pathway followed by the protein is from ER to Golgi and then to the cell membrane.
Want to see more full solutions like this?
Chapter 5 Solutions
LIFE: THE SCIENCE OF BIOLOGY


- Design a grafting experiment to determine if limb mesoderm determines forelimb / hindlimb identity. Include the experiment, a control, and an interpretation in your answer.arrow_forwardThe Snapdragon is a popular garden flower that comes in a variety of colours, including red, yellow, and orange. The genotypes and associated phenotypes for some of these flowers are as follows: aabb: yellow AABB, AABb, AaBb, and AaBB: red AAbb and Aabb: orange aaBB: yellow aaBb: ? Based on this information, what would the phenotype of a Snapdragon with the genotype aaBb be and why? Question 21 options: orange because A is epistatic to B yellow because A is epistatic to B red because B is epistatic to A orange because B is epistatic to A red because A is epistatic to B yellow because B is epistatic to Aarrow_forwardA sample of blood was taken from the above individual and prepared for haemoglobin analysis. However, when water was added the cells did not lyse and looked normal in size and shape. The technician suspected that they had may have made an error in the protocol – what is the most likely explanation? The cell membranes are more resistant than normal. An isotonic solution had been added instead of water. A solution of 0.1 M NaCl had been added instead of water. Not enough water had been added to the red blood cell pellet. The man had sickle-cell anaemia.arrow_forward
- A sample of blood was taken from the above individual and prepared for haemoglobin analysis. However, when water was added the cells did not lyse and looked normal in size and shape. The technician suspected that they had may have made an error in the protocol – what is the most likely explanation? The cell membranes are more resistant than normal. An isotonic solution had been added instead of water. A solution of 0.1 M NaCl had been added instead of water. Not enough water had been added to the red blood cell pellet. The man had sickle-cell anaemia.arrow_forwardWith reference to their absorption spectra of the oxy haemoglobin intact line) and deoxyhemoglobin (broken line) shown in Figure 2 below, how would you best explain the reason why there are differences in the major peaks of the spectra? Figure 2. SPECTRA OF OXYGENATED AND DEOXYGENATED HAEMOGLOBIN OBTAINED WITH THE RECORDING SPECTROPHOTOMETER 1.4 Abs < 0.8 06 0.4 400 420 440 460 480 500 520 540 560 580 600 nm 1. The difference in the spectra is due to a pH change in the deoxy-haemoglobin due to uptake of CO2- 2. There is more oxygen-carrying plasma in the oxy-haemoglobin sample. 3. The change in Mr due to oxygen binding causes the oxy haemoglobin to have a higher absorbance peak. 4. Oxy-haemoglobin is contaminated by carbaminohemoglobin, and therefore has a higher absorbance peak 5. Oxy-haemoglobin absorbs more light of blue wavelengths and less of red wavelengths than deoxy-haemoglobinarrow_forwardWith reference to their absorption spectra of the oxy haemoglobin intact line) and deoxyhemoglobin (broken line) shown in Figure 2 below, how would you best explain the reason why there are differences in the major peaks of the spectra? Figure 2. SPECTRA OF OXYGENATED AND DEOXYGENATED HAEMOGLOBIN OBTAINED WITH THE RECORDING SPECTROPHOTOMETER 1.4 Abs < 0.8 06 0.4 400 420 440 460 480 500 520 540 560 580 600 nm 1. The difference in the spectra is due to a pH change in the deoxy-haemoglobin due to uptake of CO2- 2. There is more oxygen-carrying plasma in the oxy-haemoglobin sample. 3. The change in Mr due to oxygen binding causes the oxy haemoglobin to have a higher absorbance peak. 4. Oxy-haemoglobin is contaminated by carbaminohemoglobin, and therefore has a higher absorbance peak 5. Oxy-haemoglobin absorbs more light of blue wavelengths and less of red wavelengths than deoxy-haemoglobinarrow_forward
- Which ONE of the following is FALSE regarding haemoglobin? It has two alpha subunits and two beta subunits. The subunits are joined by disulphide bonds. Each subunit covalently binds a haem group. Conformational change in one subunit can be transmitted to another. There are many variant ("mutant") forms of haemoglobin that are not harmful.arrow_forwardWhich ONE of the following is FALSE regarding haemoglobin? It has two alpha subunits and two beta subunits. The subunits are joined by disulphide bonds. Each subunit covalently binds a haem group. Conformational change in one subunit can be transmitted to another. There are many variant ("mutant") forms of haemoglobin that are not harmful.arrow_forwardDuring a routine medical check up of a healthy man it was found that his haematocrit value was highly unusual – value of 60%. What one of the options below is the most likely reason? He will have a diet high in iron. He is likely to be suffering from anaemia. He lives at high altitude. He has recently recovered from an accident where he lost a lot of blood. He has a very large body size.arrow_forward
- Explain what age of culture is most likely to produce an endospore?arrow_forwardExplain why hot temperatures greater than 45 degrees celsius would not initiate the sporulation process in endospores?arrow_forwardEndospore stain: Consider tube 2 of the 7-day bacillus culture. After is was heated, it was incubated for 24 hours then refrigerated. Do you think the cloudiness in this tube is due mostly to vegetative cells or to endospores? Explain your reasoningarrow_forward


 Human Heredity: Principles and Issues (MindTap Co...BiologyISBN:9781305251052Author:Michael CummingsPublisher:Cengage Learning