
Concept explainers
Videos
Inventory
Inventory refers to the stock or goods which will be sold in the near future and thus is an asset for the company. It comprises of the raw materials which are yet to be processed, the stock which is still going through the process of production and it also includes completed products that are ready for sale. Thus inventory is the biggest and the important source of income and profit for the business.
Perpetual Inventory System
In perpetual inventory system there is a continuous recording of transactions as and when they take place that is purchase and sale transactions are recorded whenever they occur.
Cost of Goods Available for Sale
It basically includes the cost of inventory which is ready for sale within an accounting period. It mainly includes the cost of beginning inventory as well as the stock purchased in that year and the production within that period (if any).
Cost of Goods Sold
Cost of goods sold is the total expenses or the cost incurred by the business during the process of manufacturing of goods and is directly related to the production. It generally includes the cost of raw material, labor and other
Gross Profit
The profit made after subtracting or debiting the costs related to the goods sold from the total revenue earned or made through sales in a fiscal year is the gross profit.
First in First out
In case of first in, first out method, also known as FIFO method, the inventory which was bought first will also be the first one to be taken out.
Last in First out
In case of last in, first out, also known as LIFO method, the inventory which was bought in the last will be taken out first.
Weighted Average Cost Method
In this method the weighted average cost is evaluated after any purchases have been made and transactions are recorded as when purchase or sales take place.
Specific Identification Method
Under this method, there is a continuous tracking of the inventory and the inventory cost at the time of purchase on the basis of unique identity which thus helps in the valuation of the ending inventory as well as the cost of goods sold. This method is used generally when the company is involved in limited expensive goods which are easily identifiable.
To compute: 1. Cost of goods available for sale and number of units available for sale.
2. Number of units in ending inventory.
3. Cost of ending inventory under the following methods:
- (a) FIFO
(b)LIFO
(c) Weighted average
(d) Specific identification
4. Gross profit for each of the four methods in part
Explanation of Solution
Given info,
| Date | Particulars | Units acquired | Cost per unit ($) | Units sold | Retail price per unit ($) |
| Apr 1 | Beginning inventory | 20 | 3,000 | ||
| Apr 6 | Purchase | 30 | 3,500 | ||
| Apr 9 | Sales | 35 | 12,000 | ||
| Apr 17 | Purchase | 5 | 4,500 | ||
| Apr 25 | Purchase | 10 | 4,800 | ||
| Apr 30 | Sales | 25 | 14,000 | ||
| Total | 65 | 60 |
The ending inventory consists of 5 units from April 17.
1.
Cost of goods available for sale
Formula to calculate Cost of goods available for sale is,
Cost and units of goods available for sale:
| Particulars | Number of units | Cost per unit($) | Amount($) |
| Beginning Inventory | 20 | 3000 | 60,000 |
| Purchases: | |||
| April 6 | 30 | 3,500 | 105,000 |
| April 17 | 5 | 4,500 | 22,500 |
| April 25 | 10 | 4,800 | 48,000 |
| Total Purchases | 45 | 175,500 | |
| Available for sale | 65 | 235,500 |
Table (1)
The cost of goods available for sale is $235,500 and the number of units available for sale is 740 units.
(2)
Number of units in ending inventory
| Particulars | Number of units |
| Number of units available for sale (given) | 65 |
| Less: units sold (given) | 60 |
| Number of units in ending inventory | 5 |
Table (2)
The number of units in ending inventory is 5 units.
3.
(a)
First in, First out method (FIFO)
Ending inventory
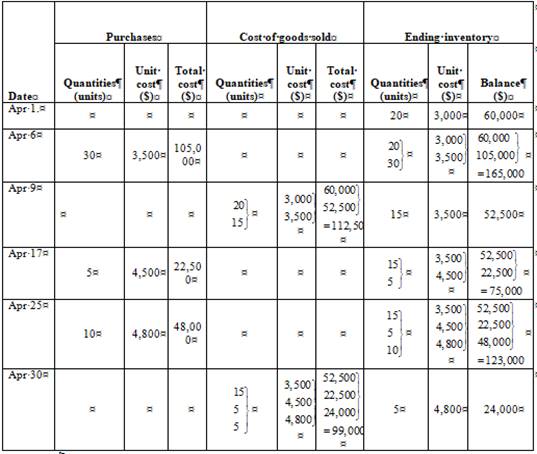
Table (3)
| Date | Purchases | Cost of goods sold | Ending inventory | ||||||
| Quantities(units) | Unit cost($) | Total cost($) | Quantities(units) | Unit cost($) | Total cost($) | Quantities(units) | Unit cost($) | Balance($) | |
| Apr 1. | 20 | 3,000 | 60,000 | ||||||
| Apr 6 | 30 | 3,500 | 105,000 | ||||||
| Apr 9 | 15 | 3,500 | 52,500 | ||||||
| Apr 17 | 5 | 4,500 | 22,500 | ||||||
| Apr 25 | 10 | 4,800 | 48,000 | ||||||
| Apr 30 | 5 | 4,800 | 24,000 | ||||||
Cost of goods sold
Formula to calculate cost of goods sold is,
Substitute $235,500 for cost of goods available for sale (calculated in part (1)) and $24,000 for cost of ending inventory (as calculated above in the table) in the above formula.
Under FIFO method, the amount of ending inventory is $24,000 and cost of goods sold is $211,500 .
(b)
Last in, first out method (LIFO)
Ending inventory
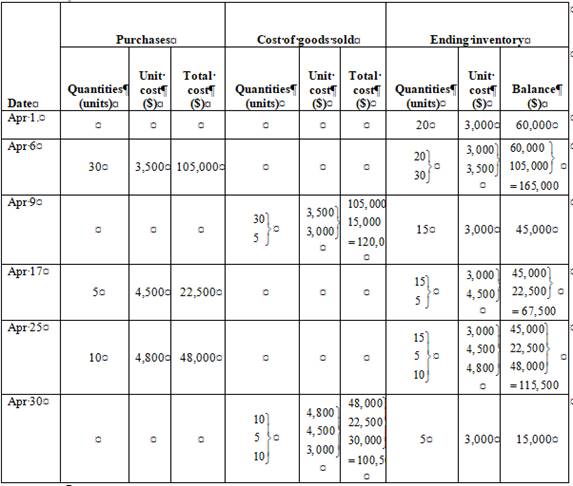
Table (4)
| Date | Purchases | Cost of goods sold | Ending inventory | ||||||
| Quantities(units) | Unit cost($) | Total cost($) | Quantities(units) | Unit cost($) | Total cost($) | Quantities(units) | Unit cost($) | Balance($) | |
| Apr 1. | 20 | 3,000 | 60,000 | ||||||
| Apr 6 | 30 | 3,500 | 105,000 | ||||||
| Apr 9 | 15 | 3,000 | 45,000 | ||||||
| Apr 17 | 5 | 4,500 | 22,500 | ||||||
| Apr 25 | 10 | 4,800 | 48,000 | ||||||
| Apr 30 | 5 | 3,000 | 15,000 | ||||||
Cost of goods sold
Formula to calculate cost of goods sold is,
Substitute $235,500 for cost of goods available for sale (calculated in part (1)) and $15,000 for cost of ending inventory (as calculated above in the table) in the above formula.
Under LIFO method, the amount of ending inventory is $15,000 and cost of goods sold is $220,500.
(c)
Weighted Average Method
Ending inventory
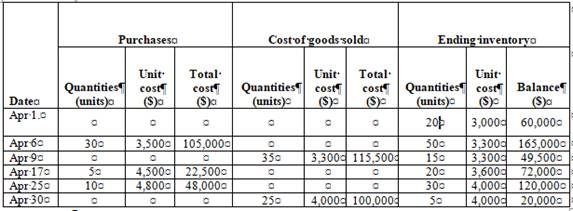
Table (5)
| Date | Purchases | Cost of goods sold | Ending inventory | ||||||
| Quantities(units) | Unit cost($) | Total cost($) | Quantities(units) | Unit cost($) | Total cost($) | Quantities(units) | Unit cost($) | Balance($) | |
| Apr 1. | 20 | 3,000 | 60,000 | ||||||
| Apr 6 | 30 | 3,500 | 105,000 | 50 | 3,300 | 165,000 | |||
| Apr 9 | 35 | 3,300 | 115,500 | 15 | 3,300 | 49,500 | |||
| Apr 17 | 5 | 4,500 | 22,500 | 20 | 3,600 | 72,000 | |||
| Apr 25 | 10 | 4,800 | 48,000 | 30 | 4,000 | 120,000 | |||
| Apr 30 | 25 | 4,000 | 100,000 | 5 | 4,000 | 20,000 | |||
Working Notes:
Calculation of weighted average cost per unit:
Cost of goods sold
Formula to calculate cost of goods sold is,
Substitute $235,500 for cost of goods available for sale (calculated in part (1)) and $20,000 for cost of ending inventory (as calculated above in the table) in the above formula.
Under weighted average method, the amount of ending inventory is $20,000 and cost of goods sold is $215,500.
(d)
Specific identification method
Given info,
The ending inventory consists of 5 units from April 17.
Cost of Ending Inventory
| Date of Purchase | Number of units(A) | Cost per unit($)(B) | Amount($) |
| April 17 | 5 | 4,500 | 22,500 |
| Cost of Ending Inventory | 22,500 | ||
Table (6)
Cost of goods sold
Formula to calculate cost of goods sold is,
Substitute $235,500 for cost of goods available for sale (calculated in part (1)) and $22,500 for cost of ending inventory (calculated above in the table) in the above formula.
The cost of ending inventory is $22,500 and the cost of goods sold is $213,000.
4.
Sales are $770,000 (working notes).
Cost of goods sold in case of FIFO is $211,500. (Calculated in part (3(a))
Cost of goods sold in case LIFO is $220,500. (Calculated in part (3(b))
Cost of goods sold in case of weighted average is $215,500 and (Calculated in part (3(c))
Cost of goods sold in case of specific identification is 213,000. (Calculated in part (3(d))
Gross Profit
Formula to calculate gross profit is,
| Particulars | FIFO | LIFO | Weighted average | Specific identification |
| Sales(working notes) | $770,000 | $$770,000 | $770,000 | $770,000 |
| Less: Cost of goods sold | $211,500 | $220,500 | $215,500 | $213,000 |
| Gross profit | $558,500 | $549,500 | $554,500 | $557,000 |
Table (7)
Working notes:
Calculation of sales
The gross profit in case of FIFO it is $558,500, of LIFO it is $549,500, of weighted average it is $554,500 and of specific identification it is $557,000.
Want to see more full solutions like this?
Chapter 5 Solutions
Gen Combo Ll Financial Accounting Fundamentals; Connect Access Card


- No Aiarrow_forwardHELParrow_forwardParkview Industries collected $275,000 from customers in 2018. Of the amount collected, $135,000 was from services performed in 2017. In addition, Parkview performed services worth $192,000 in 2018, which will not be collected until 2019. Parkview Industries also paid $218,000 for expenses in 2018. Of the amount paid, $168,000 was for expenses incurred on account in 2017. In addition, Parkview incurred $187,000 of expenses in 2018, which will not be paid until 2019. Compute 2018 cash-basis net income.arrow_forward
 Principles of Accounting Volume 1AccountingISBN:9781947172685Author:OpenStaxPublisher:OpenStax College
 College Accounting, Chapters 1-27AccountingISBN:9781337794756Author:HEINTZ, James A.Publisher:Cengage Learning,
 Cornerstones of Financial AccountingAccountingISBN:9781337690881Author:Jay Rich, Jeff JonesPublisher:Cengage Learning
 Intermediate Accounting: Reporting And AnalysisAccountingISBN:9781337788281Author:James M. Wahlen, Jefferson P. Jones, Donald PagachPublisher:Cengage Learning
 Financial AccountingAccountingISBN:9781305088436Author:Carl Warren, Jim Reeve, Jonathan DuchacPublisher:Cengage Learning
 Financial Accounting: The Impact on Decision Make...AccountingISBN:9781305654174Author:Gary A. Porter, Curtis L. NortonPublisher:Cengage Learning