
(a)
To show:
The effect on the market for wheat in the given case with the help of the
Answer to Problem 1P
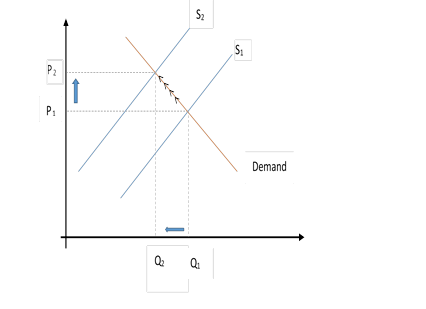
The market for wheat will see a decrease in supply. This is due to the unfavorable weather condition which will result into a higher
Explanation of Solution
The unfavorable weather condition brings a situation where there is a limitation in the supply of the wheat crop leading to an increase in price of the crop. As in
If there is a decrease in supply of wheat, then the price will go up, which will result to lowering demand that will lead to new equilibrium,
When the supply of crop of wheat falls from S1to S2due to floods, then there will be a rise in price from P1to P2.
Demand and supply curve:
Demand and supply curve represents the relationship between the quantities of the product a supplier supplies in the market and the quantity of the product a consumer demands. The point where the supply and demand curve meets are referred to as the equilibrium price.
(b)
To show:
The effect on the market for wheat in the given case with the help of the supply and demand curve.
Answer to Problem 1P
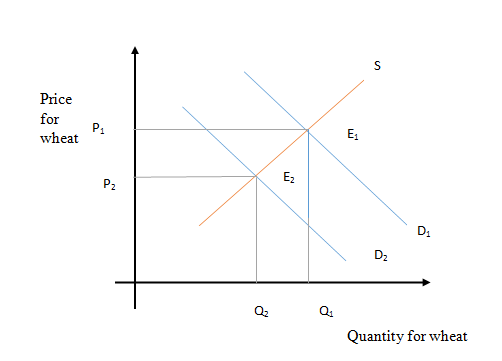
Corn is a substitute for wheat, and there is a decrease in price for corn.There will be reduction in demand for wheat resulting in a decrease of price and quantity of wheat.
When a substitute is available in the market for a product in lower price then there will be chances of drop in the demand of that product. As corn is a substitute of wheat, fall in the price of corn will lead to a decrease in demand for wheat, resulting in leftward shift of demand curve. The prices and quantity of wheat will go down causing new equilibrium, E2.
In this case, it could be seen that with decrease of demand of wheat from D1to D2, there will be a shift in price of wheat too from P1 to P2.
(c)
To show:
The effect on the market for wheat in the given case with the help of the supply and demand curve.
Demand and supply curve:
Demand and supply curve represents the relationship between the quantities of product a supplier supplies in the market and quantity of product a consumer demand. The point where the supply and demand curves meet is referred to as the equilibrium price. This is the price at which a supplier agrees to supply the commodities and the consumers agree to buy.
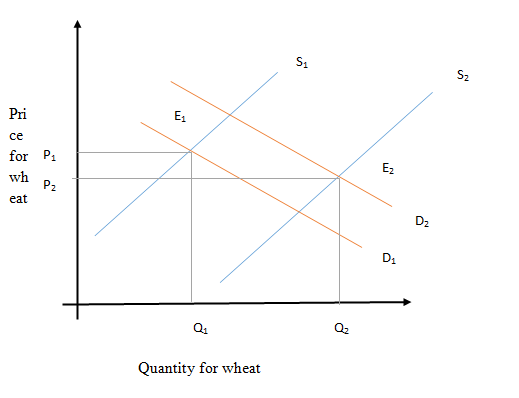
If it is a favorable weather condition for wheat, it would result to the increase in the production of wheat, leading into the increase in the supply of wheat.
In the given case, initial equilibrium is represented with
With the increase of supply in wheat, there will be lower equilibrium of price represented by
(d)
To show:
The effect on the market for wheat in the given case with the help of the supply and demand curve.
Demand and supply curve:
Demand and supply curve represents the relationship between the quantities of product a supplier supplies in the market and quantity of product a consumer demands. The point where the supply and demand curves meet is referred to as the equilibrium price. This is the price at which a supplier agrees to supply the commodities and the consumers agree to buy.
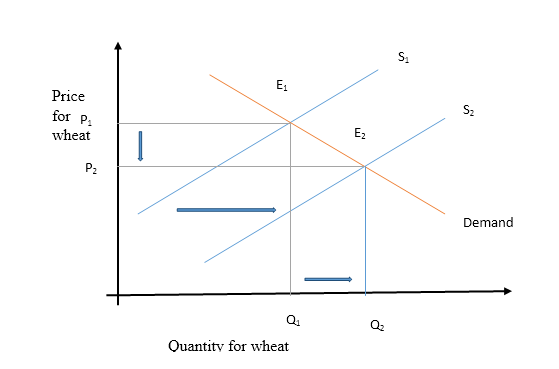
With the falling price of fertilizers, there will be an increase in the supply of wheat. This will result into dipping of the price of wheat and increase in the equilibrium quantity traded.
Fertilizer is one of the core component in agriculture. Any change in price of the fertilizers would affect the demand and supply condition of crop too. With the fall in price of fertilizers, the cost of producing wheat will go down that will lead to increase in supply. As a result of increase in supply, price of wheat will go down, but the movement of supply curve will outweigh the movement of price leading into equilibrium price of wheat to fall (from P1 to P2).
In the graph, there is a rise in supply from S1to S2, which will lead to a fall in the price from P1to P2.
(e)
To show:
The effect on the market for wheat in the given case with the help of the supply and demand curve.
Demand and supply curve:
Demand and supply curve represents the relationship between the quantities of product a supplier supplies in the market and quantity of product a consumer demand. The point where the supply and demand curves meet is referred to as the equilibrium price. This is the price at which a supplier agrees to supply the commodities and the consumers agree to buy.
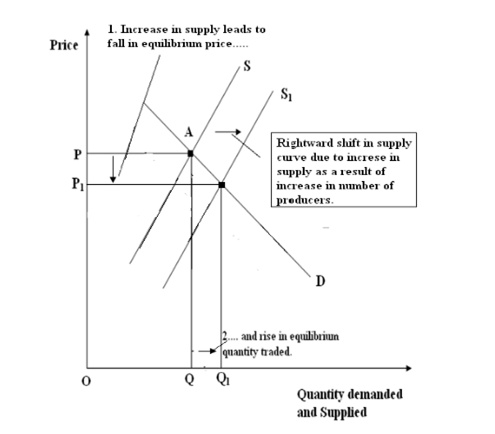
With the involvement of more individual in growing wheat there will be increase in supply of wheat. This will result into price of wheat dipping.
The initial equilibrium is at point A.With increase in wheat growers the supply of the wheat will also increase. The initial supply curve will shift rightwards from S to S1,the change in supply will form new equilibrium at point B, by intersection of new supply curve S1and demand curve D.
Due to the increase in supply of wheat, the price will decrease from P to P1with increase in equilibrium quantity traded at Q1.
Explanation of Solution
When a substitute is available in the market for a product in lower price then there will be chances of drop in the demand of that product. As corn is a substitute of wheat, fall in the price of corn will lead to a decrease in demand for wheat, resulting in leftward shift of demand curve. The prices and quantity of wheat will go down causing new equilibrium, E2.
In this case, it could be seen that with decrease of demand of wheat from D1to D2, there will be a shift in price of wheat too from P1 to P2.
Demand and supply curve:
Demand and supply curve represents the relationship between the quantities of product a supplier supplies in the market and the quantity of product a consumer demands. The point where the supply and demand curves meet is referred to as the equilibrium price. This is the price at which a supplier agrees to supply the commodities and the consumers agree to buy.
(c)
To show:
The effect on the market for wheat in the given case with the help of the supply and demand curve.
Answer to Problem 1P
If it is a favorable weather condition for wheat, it would result to the increase in the production of wheat, leading into the increase in the supply of wheat.
Explanation of Solution
In the given case, initial equilibrium is represented with
With the increase of supply in wheat, there will be lower equilibrium of price represented by
Demand and supply curve:
Demand and supply curve represents the relationship between the quantities of product a supplier supplies in the market and quantity of product a consumer demand. The point where the supply and demand curves meet is referred to as the equilibrium price. This is the price at which a supplier agrees to supply the commodities and the consumers agree to buy.
(d)
To show:
The effect on the market for wheat in the given case with the help of the supply and demand curve.
Answer to Problem 1P
With the falling price of fertilizers, there will be an increase in the supply of wheat. This will result into dipping of the price of wheat and increase in the equilibrium quantity traded.
Explanation of Solution
Fertilizer is one of the core component in agriculture. Any change in price of the fertilizers would affect the demand and supply condition of crop too. With the fall in price of fertilizers, the cost of producing wheat will go down that will lead to increase in supply. As a result of increase in supply, price of wheat will go down, but the movement of supply curve will outweigh the movement of price leading into equilibrium price of wheat to fall (from P1 to P2).
In the graph, there is a rise in supply from S1to S2, which will lead to a fall in the price from P1to P2.
Demand and supply curve:
Demand and supply curve represents the relationship between the quantities of product a supplier supplies in the market and quantity of product a consumer demands. The point where the supply and demand curves meet is referred to as the equilibrium price. This is the price at which a supplier agrees to supply the commodities and the consumers agree to buy.
(e)
To show:
The effect on the market for wheat in the given case with the help of the supply and demand curve.
Answer to Problem 1P
With the involvement of more individual in growing wheat there will be increase in supply of wheat. This will result into price of wheat dipping.
Explanation of Solution
The initial equilibrium is at point A.With increase in wheat growers the supply of the wheat will also increase. The initial supply curve will shift rightwards from S to S1,the change in supply will form new equilibrium at point B, by intersection of new supply curve S1and demand curve D.
Due to the increase in supply of wheat, the price will decrease from P to P1with increase in equilibrium quantity traded at Q1.
Demand and supply curve:
Demand and supply curve represents the relationship between the quantities of product a supplier supplies in the market and quantity of product a consumer demand. The point where the supply and demand curves meet is referred to as the equilibrium price. This is the price at which a supplier agrees to supply the commodities and the consumers agree to buy.
Want to see more full solutions like this?
Chapter 5 Solutions
Exploring Macroeconomics

- 2. What is the payoff from a long futures position where you are obligated to buy at the contract price? What is the payoff from a short futures position where you are obligated to sell at the contract price?? Draw the payoff diagram for each position. Payoff from Futures Contract F=$50.85 S1 Long $100 $95 $90 $85 $80 $75 $70 $65 $60 $55 $50.85 $50 $45 $40 $35 $30 $25 Shortarrow_forward3. Consider a call on the same underlier (Cisco). The strike is $50.85, which is the forward price. The owner of the call has the choice or option to buy at the strike. They get to see the market price S1 before they decide. We assume they are rational. What is the payoff from owning (also known as being long) the call? What is the payoff from selling (also known as being short) the call? Payoff from Call with Strike of k=$50.85 S1 Long $100 $95 $90 $85 $80 $75 $70 $65 $60 $55 $50.85 $50 $45 $40 $35 $30 $25 Shortarrow_forward4. Consider a put on the same underlier (Cisco). The strike is $50.85, which is the forward price. The owner of the call has the choice or option to buy at the strike. They get to see the market price S1 before they decide. We assume they are rational. What is the payoff from owning (also known as being long) the put? What is the payoff from selling (also known as being short) the put? Payoff from Put with Strike of k=$50.85 S1 Long $100 $95 $90 $85 $80 $75 $70 $65 $60 $55 $50.85 $50 $45 $40 $35 $30 $25 Shortarrow_forward
- The following table provides information on two technology companies, IBM and Cisco. Use the data to answer the following questions. Company IBM Cisco Systems Stock Price Dividend (trailing 12 months) $150.00 $50.00 $7.00 Dividend (next 12 months) $7.35 Dividend Growth 5.0% $2.00 $2.15 7.5% 1. You buy a futures contract instead of purchasing Cisco stock at $50. What is the one-year futures price, assuming the risk-free interest rate is 6%? Remember to adjust the futures price for the dividend of $2.15.arrow_forward5. Consider a one-year European-style call option on Cisco stock. The strike is $50.85, which is the forward price. The risk-free interest rate is 6%. Assume the stock price either doubles or halves each period. The price movement corresponds to u = 2 and d = ½ = 1/u. S1 = $100 Call payoff= SO = $50 S1 = $25 Call payoff= What is the call payoff for $1 = $100? What is the call payoff for S1 = $25?arrow_forwardMC The diagram shows a pharmaceutical firm's demand curve and marginal cost curve for a new heart medication for which the firm holds a 20-year patent on its production. Assume this pharmaceutical firm charges a single price for its drug. At its profit-maximizing level of output, it will generate a total profit represented by OA. areas J+K. B. areas F+I+H+G+J+K OC. areas E+F+I+H+G. D. - it is not possible to determine with the informatio OE. the sum of areas A through K. (...) Po P1 Price F P2 E H 0 G B Q MR D ōarrow_forward
- Price Quantity $26 0 The marketing department of $24 20,000 Johnny Rockabilly's record company $22 40,000 has determined that the demand for his $20 60,000 latest CD is given in the table at right. $18 80,000 $16 100,000 $14 120,000 The record company's costs consist of a $240,000 fixed cost of recording the CD, an $8 per CD variable cost of producing and distributing the CD, plus the cost of paying Johnny for his creative talent. The company is considering two plans for paying Johnny. Plan 1: Johnny receives a zero fixed recording fee and a $4 per CD royalty for each CD that is sold. Plan 2: Johnny receives a $400,000 fixed recording fee and zero royalty per CD sold. Under either plan, the record company will choose the price of Johnny's CD so as to maximize its (the record company's) profit. The record company's profit is the revenues minus costs, where the costs include the costs of production, distribution, and the payment made to Johnny. Johnny's payment will be be under plan 2 as…arrow_forwardWhich of the following is the best example of perfect price discrimination? A. Universities give entry scholarships to poorer students. B. Students pay lower prices at the local theatre. ○ C. A hotel charges for its rooms according to the number of days left before the check-in date. ○ D. People who collect the mail coupons get discounts at the local food store. ○ E. An airline offers a discount to students.arrow_forwardConsider the figure at the right. The profit of the single-price monopolist OA. is shown by area D+H+I+F+A. B. is shown by area A+I+F. OC. is shown by area D + H. ○ D. is zero. ○ E. cannot be calculated or shown with just the information given in the graph. (C) Price ($) B C D H FIG шо E MC ATC A MR D = AR Quantityarrow_forward
- Consider the figure. A perfectly price-discriminating monopolist will produce ○ A. 162 units and charge a price equal to $69. ○ B. 356 units and charge a price equal to $52 for the last unit sold only. OC. 162 units and charge a price equal to $52. OD. 356 units and charge a price equal to the perfectly competitive price. Dollars per Unit $69 $52 MR 162 356 Output MC Darrow_forwardThe figure at right shows the demand line, marginal revenue line, and cost curves for a single-price monopolist. Now suppose the monopolist is able to charge a different price on each different unit sold. The profit-maximizing quantity for the monopolist is (Round your response to the nearest whole number.) The price charged for the last unit sold by this monopolist is $ (Round your response to the nearest dollar.) Price ($) 250 225- 200- The monopolist's profit is $ the nearest dollar.) (Round your response to MC 175- 150 ATC 125- 100- 75- 50- 25- 0- °- 0 20 40 60 MR 80 100 120 140 160 180 200 Quantityarrow_forwardThe diagram shows a pharmaceutical firm's demand curve and marginal cost curve for a new heart medication for which the firm holds a 20-year patent on its production. At its profit-maximizing level of output, it will generate a deadweight loss to society represented by what? A. There is no deadweight loss generated. B. Area H+I+J+K OC. Area H+I D. Area D + E ◇ E. It is not possible to determine with the information provided. (...) 0 Price 0 m H B GI A MR MC D Outparrow_forward
 Economics (MindTap Course List)EconomicsISBN:9781337617383Author:Roger A. ArnoldPublisher:Cengage Learning

 Microeconomics: Private and Public Choice (MindTa...EconomicsISBN:9781305506893Author:James D. Gwartney, Richard L. Stroup, Russell S. Sobel, David A. MacphersonPublisher:Cengage Learning
 Macroeconomics: Private and Public Choice (MindTa...EconomicsISBN:9781305506756Author:James D. Gwartney, Richard L. Stroup, Russell S. Sobel, David A. MacphersonPublisher:Cengage Learning
 Economics: Private and Public Choice (MindTap Cou...EconomicsISBN:9781305506725Author:James D. Gwartney, Richard L. Stroup, Russell S. Sobel, David A. MacphersonPublisher:Cengage Learning