
(a)
To show:
The effect on the market for wheat in the given case with the help of the
Answer to Problem 1P
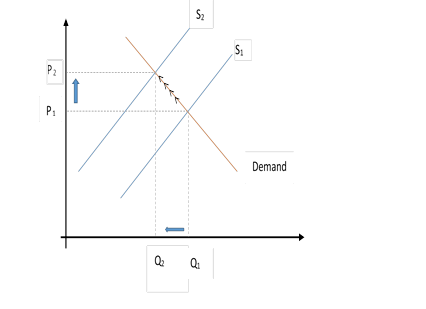
The market for wheat will see a decrease in supply. This is due to the unfavorable weather condition which will result into a higher
Explanation of Solution
The unfavorable weather condition brings a situation where there is a limitation in the supply of the wheat crop leading to an increase in price of the crop. As in
If there is a decrease in supply of wheat, then the price will go up, which will result to lowering demand that will lead to new equilibrium,
When the supply of crop of wheat falls from S1to S2due to floods, then there will be a rise in price from P1to P2.
Demand and supply curve:
Demand and supply curve represents the relationship between the quantities of the product a supplier supplies in the market and the quantity of the product a consumer demands. The point where the supply and demand curve meets are referred to as the equilibrium price.
(b)
To show:
The effect on the market for wheat in the given case with the help of the supply and demand curve.
Answer to Problem 1P
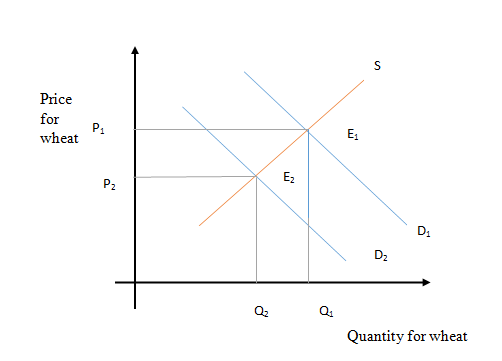
Corn is a substitute for wheat, and there is a decrease in price for corn.There will be reduction in demand for wheat resulting in a decrease of price and quantity of wheat.
When a substitute is available in the market for a product in lower price then there will be chances of drop in the demand of that product. As corn is a substitute of wheat, fall in the price of corn will lead to a decrease in demand for wheat, resulting in leftward shift of demand curve. The prices and quantity of wheat will go down causing new equilibrium, E2.
In this case, it could be seen that with decrease of demand of wheat from D1to D2, there will be a shift in price of wheat too from P1 to P2.
(c)
To show:
The effect on the market for wheat in the given case with the help of the supply and demand curve.
Demand and supply curve:
Demand and supply curve represents the relationship between the quantities of product a supplier supplies in the market and quantity of product a consumer demand. The point where the supply and demand curves meet is referred to as the equilibrium price. This is the price at which a supplier agrees to supply the commodities and the consumers agree to buy.
If it is a favorable weather condition for wheat, it would result to the increase in the production of wheat, leading into the increase in the supply of wheat.
In the given case, initial equilibrium is represented with
With the increase of supply in wheat, there will be lower equilibrium of price represented by
(d)
To show:
The effect on the market for wheat in the given case with the help of the supply and demand curve.
Demand and supply curve:
Demand and supply curve represents the relationship between the quantities of product a supplier supplies in the market and quantity of product a consumer demands. The point where the supply and demand curves meet is referred to as the equilibrium price. This is the price at which a supplier agrees to supply the commodities and the consumers agree to buy.
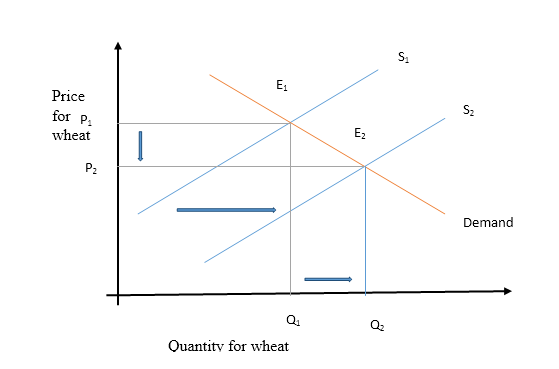
With the falling price of fertilizers, there will be an increase in the supply of wheat. This will result into dipping of the price of wheat and increase in the equilibrium quantity traded.
Fertilizer is one of the core component in agriculture. Any change in price of the fertilizers would affect the demand and supply condition of crop too. With the fall in price of fertilizers, the cost of producing wheat will go down that will lead to increase in supply. As a result of increase in supply, price of wheat will go down, but the movement of supply curve will outweigh the movement of price leading into equilibrium price of wheat to fall (from P1 to P2).
In the graph, there is a rise in supply from S1to S2, which will lead to a fall in the price from P1to P2.
(e)
To show:
The effect on the market for wheat in the given case with the help of the supply and demand curve.
Demand and supply curve:
Demand and supply curve represents the relationship between the quantities of product a supplier supplies in the market and quantity of product a consumer demand. The point where the supply and demand curves meet is referred to as the equilibrium price. This is the price at which a supplier agrees to supply the commodities and the consumers agree to buy.
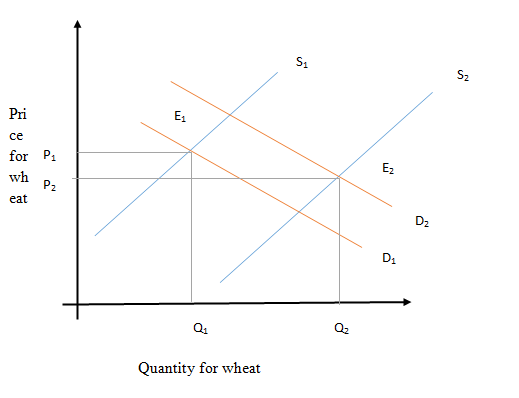
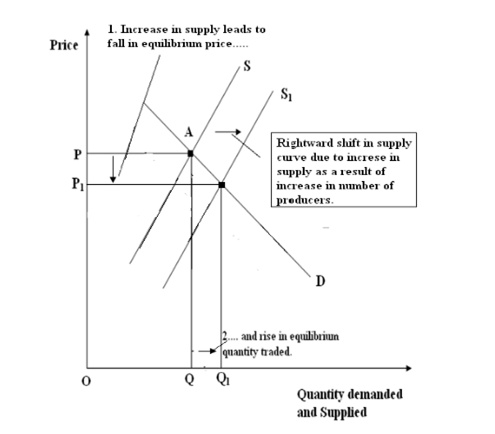
With the involvement of more individual in growing wheat there will be increase in supply of wheat. This will result into price of wheat dipping.
The initial equilibrium is at point A.With increase in wheat growers the supply of the wheat will also increase. The initial supply curve will shift rightwards from S to S1,the change in supply will form new equilibrium at point B, by intersection of new supply curve S1and demand curve D.
Due to the increase in supply of wheat, the price will decrease from P to P1with increase in equilibrium quantity traded at Q1.
Explanation of Solution
When a substitute is available in the market for a product in lower price then there will be chances of drop in the demand of that product. As corn is a substitute of wheat, fall in the price of corn will lead to a decrease in demand for wheat, resulting in leftward shift of demand curve. The prices and quantity of wheat will go down causing new equilibrium, E2.
In this case, it could be seen that with decrease of demand of wheat from D1to D2, there will be a shift in price of wheat too from P1 to P2.
Demand and supply curve:
Demand and supply curve represents the relationship between the quantities of product a supplier supplies in the market and the quantity of product a consumer demands. The point where the supply and demand curves meet is referred to as the equilibrium price. This is the price at which a supplier agrees to supply the commodities and the consumers agree to buy.
(c)
To show:
The effect on the market for wheat in the given case with the help of the supply and demand curve.
Answer to Problem 1P
If it is a favorable weather condition for wheat, it would result to the increase in the production of wheat, leading into the increase in the supply of wheat.
Explanation of Solution
In the given case, initial equilibrium is represented with
With the increase of supply in wheat, there will be lower equilibrium of price represented by
Demand and supply curve:
Demand and supply curve represents the relationship between the quantities of product a supplier supplies in the market and quantity of product a consumer demand. The point where the supply and demand curves meet is referred to as the equilibrium price. This is the price at which a supplier agrees to supply the commodities and the consumers agree to buy.
(d)
To show:
The effect on the market for wheat in the given case with the help of the supply and demand curve.
Answer to Problem 1P
With the falling price of fertilizers, there will be an increase in the supply of wheat. This will result into dipping of the price of wheat and increase in the equilibrium quantity traded.
Explanation of Solution
Fertilizer is one of the core component in agriculture. Any change in price of the fertilizers would affect the demand and supply condition of crop too. With the fall in price of fertilizers, the cost of producing wheat will go down that will lead to increase in supply. As a result of increase in supply, price of wheat will go down, but the movement of supply curve will outweigh the movement of price leading into equilibrium price of wheat to fall (from P1 to P2).
In the graph, there is a rise in supply from S1to S2, which will lead to a fall in the price from P1to P2.
Demand and supply curve:
Demand and supply curve represents the relationship between the quantities of product a supplier supplies in the market and quantity of product a consumer demands. The point where the supply and demand curves meet is referred to as the equilibrium price. This is the price at which a supplier agrees to supply the commodities and the consumers agree to buy.
(e)
To show:
The effect on the market for wheat in the given case with the help of the supply and demand curve.
Answer to Problem 1P
With the involvement of more individual in growing wheat there will be increase in supply of wheat. This will result into price of wheat dipping.
Explanation of Solution
The initial equilibrium is at point A.With increase in wheat growers the supply of the wheat will also increase. The initial supply curve will shift rightwards from S to S1,the change in supply will form new equilibrium at point B, by intersection of new supply curve S1and demand curve D.
Due to the increase in supply of wheat, the price will decrease from P to P1with increase in equilibrium quantity traded at Q1.
Demand and supply curve:
Demand and supply curve represents the relationship between the quantities of product a supplier supplies in the market and quantity of product a consumer demand. The point where the supply and demand curves meet is referred to as the equilibrium price. This is the price at which a supplier agrees to supply the commodities and the consumers agree to buy.
Want to see more full solutions like this?

- Critically analyse the five (5) characteristics of Ubuntu and provide examples of how they apply to the National Health Insurance (NHI) in South Africa.arrow_forwardCritically analyse the five (5) characteristics of Ubuntu and provide examples of how they apply to the National Health Insurance (NHI) in South Africa.arrow_forwardOutline the nine (9) consumer rights as specified in the Consumer Rights Act in South Africa.arrow_forward
- In what ways could you show the attractiveness of Philippines in the form of videos/campaigns to foreign investors? Cite 10 examples.arrow_forwardExplain the following terms and provide an example for each term: • Corruption • Fraud • Briberyarrow_forwardIn what ways could you show the attractiveness of a country in the form of videos/campaigns?arrow_forward
- With the VBS scenario in mind, debate with your own words the view that stakeholders are the primary reason why business ethics must be implemented.arrow_forwardThe unethical decisions taken by the VBS management affected the lives of many of their clients who trusted their business and services You are appointed as an ethics officer at Tyme Bank. Advise the management regarding the role of legislation in South Africa in providing the legal framework for business operations.arrow_forwardTyme Bank is a developing bank in South Africa and could potentially encounter challenges similar to those faced by VBS in the future. Explain five (5) benefits of applying business ethics at Tyme Bank to prevent similar ethical scandals.arrow_forward
 Economics (MindTap Course List)EconomicsISBN:9781337617383Author:Roger A. ArnoldPublisher:Cengage Learning

 Microeconomics: Private and Public Choice (MindTa...EconomicsISBN:9781305506893Author:James D. Gwartney, Richard L. Stroup, Russell S. Sobel, David A. MacphersonPublisher:Cengage Learning
 Macroeconomics: Private and Public Choice (MindTa...EconomicsISBN:9781305506756Author:James D. Gwartney, Richard L. Stroup, Russell S. Sobel, David A. MacphersonPublisher:Cengage Learning
 Economics: Private and Public Choice (MindTap Cou...EconomicsISBN:9781305506725Author:James D. Gwartney, Richard L. Stroup, Russell S. Sobel, David A. MacphersonPublisher:Cengage Learning