(a)
Assume the following information for
| Demand | Demand | Supply | Supply |
| Quantity demanded | Price | Quantity supplied | |
| | | | |
| | | | |
| | | | |
| | | | |
| | | | |
| | | | |
| | | | |
| | | | |
| | | | |
| | | | |
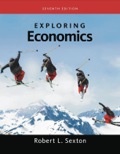
Illustrate demand and supply curve.
Answer to Problem 25P
Following graph represents the demand and supply curve of good Z
Explanation of Solution
The above graph represents the supply and demand curve of good Z. The intersecting point is the equilibrium point at which the demand for the products is equal to the supply of the products. The upward movement of the supply curve represents that with an increase in the price of the product the supplier will increase the supply whereas the downwards movement of the demand curve represents a decrease in demand of the product with an increase in the price of the product.
Introduction:
Demand and supply curve represents relationship between the quantity of product a supplier supplies in the market and quantity of product consumers demands. The point where supply and demand curve meets is referred to as
(b)
Assume the following information for demand and supply curve for good Z
| Demand | Demand | Supply | Supply |
| Price | Quantity demanded | Price | Quantity supplied |
| | | | |
| | | | |
| | | | |
| | | | |
| | | | |
| | | | |
| | | | |
| | | | |
| | | | |
| | | | |
Determine the equilibrium price and the quantity traded
Answer to Problem 25P
In the given data the equilibrium price is
Explanation of Solution
In the given table, one can observe that at price
Therefore, the equilibrium price is
Introduction:
Equilibrium price is the price at which the amount of quantity supplied is equal to the amount of quantity demanded, it is the price at which both the supplier and consumer is ready to trade the goods.
The amount of quantity traded in between in the suppliers and consumers are the
(c)
Assume the following information for demand and supply curve for good Z
| Demand | Demand | Supply | Supply |
| Price | Quantity demanded | Price | Quantity supplied |
| | | | |
| | | | |
| | | | |
| | | | |
| | | | |
| | | | |
| | | | |
| | | | |
| | | | |
| | | | |
Determine whether it is surplus or shortage at price
Answer to Problem 25P
At price
Explanation of Solution
In the given table at price,
Since the quantity supplied is more than quantity demanded, therefore there is surplus at price
To calculate surplus
Thus the surplus at price
Introduction:
Surplus occurs when the quantity supplied by the supplier exceeds the quantity demanded in the market.
Shortage occurs when the quantity demanded by the consumers exceeds the quantity supplied by the supplier in the market.
(d)
Assume the following information for demand and supply curve for good Z
| Demand | Demand | Supply | Supply |
| Price | Quantity demanded | Price | Quantity supplied |
| | | | |
| | | | |
| | | | |
| | | | |
| | | | |
| | | | |
| | | | |
| | | | |
| | | | |
| | | | |
Determine whether it is surplus or shortage at price
Answer to Problem 25P
At price
Explanation of Solution
In the given table at price,
To calculate shortage
Therefore ate price
Introduction:
Surplus occurs when the quantity supplied by the supplier exceeds the quantity demanded in the market.
Shortage occurs when the quantity demanded by the consumers exceeds the quantity supplied by the supplier in the market
(e)
Assume the following information for demand and supply curve for good Z
| Demand | Demand | Supply | Supply |
| Price | Quantity demanded | Price | Quantity supplied |
| | | | |
| | | | |
| | | | |
| | | | |
| | | | |
| | | | |
| | | | |
| | | | |
| | | | |
| | | | |
Determine the new equilibrium price and quantity traded if demand for Z increased by
Answer to Problem 25P
New equilibrium price of the good is
Explanation of Solution
According to the given situation, the quantity demanded increases by
Therefore the new quantity demanded is represented in the table below
| Demand | Demand | Demand | Supply | Supply |
| Price | Quantity demanded | New Quantity after addition of 15 Units | Price | Quantity supplied |
| | | | | |
| | | | | |
| | | | | |
| | | | | |
| | | | | |
| | | | | |
| | | | | |
| | | | | |
| | | | | |
| | | | | |
After the addition of 15 units in quantity demanded column, one can observe the equilibrium price shifted at price
Introduction:
Equilibrium price is the price at which the amount of quantity supplied is equal to the amount of quantity demanded, it is the price at which both the supplier and consumer is ready to trade the goods.
(f)
Assume the following information for demand and supply curve for good Z
| Demand | Demand | Supply | Supply |
| Price | Quantity demanded | Price | Quantity supplied |
| | | | |
| | | | |
| | | | |
| | | | |
| | | | |
| | | | |
| | | | |
| | | | |
| | | | |
| | | | |
Determine the new equilibrium price and quantity traded if the supply of Z is increased by
Answer to Problem 25P
When the supply is increased by 15 units the new equilibrium price will be
Explanation of Solution
The new supply column when the supply of Z is increased by 15 units at each price point is shown as below
| Demand | Demand | Supply | Supply | |
| Price | Quantity demanded | Price | Quantity supplied | New quantity supplied with addition of 15 units |
| | | | | |
| | | | | |
| | | | | |
| | | | | |
| | | | | |
| | | | | |
| | | | | |
| | | | | |
| | | | | |
| | | | | |
After the addition of 15 units in the supply column one can observe that the equilibrium is shifted at price
Introduction:
Equilibrium price is the price at which the amount of quantity supplied is equal to the amount of quantity demanded, it is the price at which both the supplier and consumer is ready to trade the goods.
Want to see more full solutions like this?

- Critically analyse the five (5) characteristics of Ubuntu and provide examples of how they apply to the National Health Insurance (NHI) in South Africa.arrow_forwardCritically analyse the five (5) characteristics of Ubuntu and provide examples of how they apply to the National Health Insurance (NHI) in South Africa.arrow_forwardOutline the nine (9) consumer rights as specified in the Consumer Rights Act in South Africa.arrow_forward
- In what ways could you show the attractiveness of Philippines in the form of videos/campaigns to foreign investors? Cite 10 examples.arrow_forwardExplain the following terms and provide an example for each term: • Corruption • Fraud • Briberyarrow_forwardIn what ways could you show the attractiveness of a country in the form of videos/campaigns?arrow_forward
 Exploring EconomicsEconomicsISBN:9781544336329Author:Robert L. SextonPublisher:SAGE Publications, Inc
 Economics (MindTap Course List)EconomicsISBN:9781337617383Author:Roger A. ArnoldPublisher:Cengage Learning

 Microeconomics: Principles & PolicyEconomicsISBN:9781337794992Author:William J. Baumol, Alan S. Blinder, John L. SolowPublisher:Cengage Learning