Four Children (Example 3) The sample space given here shows all possible sequences for a family with 4 children, where B stands for boy and G stands for girl. Assume that all of the 16 outcomes are equally likely. Find the probability of having the following numbers of girls out of 4 children: (a) exactly 0 girls, (b) exactly I girl, (c) exactly 2 girls, (d) exactly 3 girls, (e) exactly 4 girls. (Hint: The probability of having 3 girls and a boy is 4 16 , or 25 % , because the second column shows that there are 4 ways to have 3 girls and 1 boy.)
Four Children (Example 3) The sample space given here shows all possible sequences for a family with 4 children, where B stands for boy and G stands for girl. Assume that all of the 16 outcomes are equally likely. Find the probability of having the following numbers of girls out of 4 children: (a) exactly 0 girls, (b) exactly I girl, (c) exactly 2 girls, (d) exactly 3 girls, (e) exactly 4 girls. (Hint: The probability of having 3 girls and a boy is 4 16 , or 25 % , because the second column shows that there are 4 ways to have 3 girls and 1 boy.)
Solution Summary: The author determines the probability of having the following number of girls in a family with 4 children. All possible sequences are given.
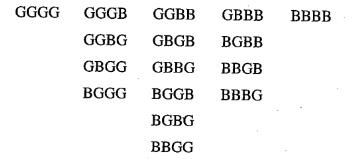
Four Children (Example 3) The sample space given here shows all possible sequences for a family with 4 children, where B stands for boy and G stands for girl.
Assume that all of the 16 outcomes are equally likely. Find the probability of having the following numbers of girls out of 4 children: (a) exactly 0 girls, (b) exactly I girl, (c) exactly 2 girls, (d) exactly 3 girls, (e) exactly 4 girls.
(Hint: The probability of having 3 girls and a boy is
4
16
, or
25
%
, because the second column shows that there are 4 ways to have 3 girls and 1 boy.)
Definition Definition For any random event or experiment, the set that is formed with all the possible outcomes is called a sample space. When any random event takes place that has multiple outcomes, the possible outcomes are grouped together in a set. The sample space can be anything, from a set of vectors to real numbers.
A major company in the Montreal area, offering a range of engineering services from project preparation to construction execution, and industrial project management, wants to ensure that the individuals who are responsible for project cost estimation and bid preparation demonstrate a certain uniformity in their estimates. The head of civil engineering and municipal services decided to structure an experimental plan to detect if there could be significant differences in project evaluation.
Seven projects were selected, each of which had to be evaluated by each of the two estimators, with the order of the projects submitted being random. The obtained estimates are presented in the table below.
a) Complete the table above by calculating: i. The differences (A-B) ii. The sum of the differences iii. The mean of the differences iv. The standard deviation of the differences
b) What is the value of the t-statistic?
c) What is the critical t-value for this test at a significance level of 1%?…
Compute the relative risk of falling for the two groups (did not stop walking vs. did stop). State/interpret your result verbally.
Finite Mathematics for Business, Economics, Life Sciences and Social Sciences
Knowledge Booster
Learn more about
Need a deep-dive on the concept behind this application? Look no further. Learn more about this topic, statistics and related others by exploring similar questions and additional content below.
Probability & Statistics (28 of 62) Basic Definitions and Symbols Summarized; Author: Michel van Biezen;https://www.youtube.com/watch?v=21V9WBJLAL8;License: Standard YouTube License, CC-BY
Introduction to Probability, Basic Overview - Sample Space, & Tree Diagrams; Author: The Organic Chemistry Tutor;https://www.youtube.com/watch?v=SkidyDQuupA;License: Standard YouTube License, CC-BY


 College Algebra (MindTap Course List)AlgebraISBN:9781305652231Author:R. David Gustafson, Jeff HughesPublisher:Cengage Learning
 Holt Mcdougal Larson Pre-algebra: Student Edition...AlgebraISBN:9780547587776Author:HOLT MCDOUGALPublisher:HOLT MCDOUGAL
 Glencoe Algebra 1, Student Edition, 9780079039897...AlgebraISBN:9780079039897Author:CarterPublisher:McGraw Hill
 College AlgebraAlgebraISBN:9781305115545Author:James Stewart, Lothar Redlin, Saleem WatsonPublisher:Cengage Learning