
ESSEN OF BUSINESS ANALYTICS (LL) BOM
2nd Edition
ISBN: 9781337128629
Author: Camm
Publisher: CENGAGE L
expand_more
expand_more
format_list_bulleted
Videos
Textbook Question
Chapter 5, Problem 15P
The percent frequency distributions of job satisfaction scores for a sample of information systems (IS) senior executives and middle managers are as follows. The scores
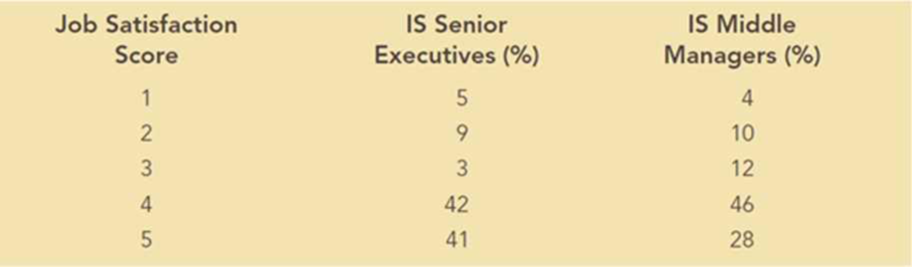
- a. Develop a
probability distribution for the job satisfaction score of a randomly selected senior executive. - b. Develop a probability distribution for the job satisfaction score of a randomly selected middle manager.
- c. What is the probability that a randomly selected senior executive will report a job satisfaction score of 4 or 5?
- d. What is the probability that a randomly selected middle manager is very satisfied?
- e. Compare the overall job satisfaction of senior executives and middle managers.
Expert Solution & Answer
Want to see the full answer?
Check out a sample textbook solution
Students have asked these similar questions
A fitness trainer wants to estimate the effect of fitness activities on muscle mass for different weight categories of club members. They choose the most popular fitness classes at the gym: yoga, circuit training, and high-intensity interval training (HIIT). Suppose that the weights of club members are separated into three levels: under 155 pounds, 155 – 200 pounds, and over 200 pounds. Draw a flow chart showing the design of this experiment.
The systolic blood pressure of individuals is thought to be related to both age and weight. Let the systolic blood pressure, age, and weight be represented by the variables x1, x2, and x3, respectively. Suppose that Minitab was used to generate the following descriptive statistics, correlations, and regression analysis for a random sample of 15 individuals.
Descriptive Statistics
Variable
N
Mean
Median
TrMean
StDev
SE Mean
x 1
15
154.14
154.34
154.14
3.842
0.992000
x 2
15
59.69
60.19
59.69
1.462
0.377487
x 3
15
205.55
204.75
205.55
4.558
1.176871
Variable
Minimum
Maximum
Q1
Q3
x 1
125
178
141.803
167.244
x 2
41
80
47.754
78.415
x 3
126
240
140.395
224.008
Correlations (Pearson)
x 1
x 2
x 2
0.892
x 3
0.839
0.567
Regression Analysis
The regression equation is
x 1 = 0.883 + 1.257x2 + 0.871x3
Predictor
Coef
StDev
T
P
Constant
0.883
0.635
1.39
0.095
x 2
1.257
0.635
1.98
0.036
x 3
0.871
0.419
2.08
0.030
S = 0.428
R-sq = 92.7 %…
According to health professionals, a person’s weight is expected to increase with age. To examine that statement, a nutritionist collected data from 11 random females from different age categories between the ages of 21 and 43. In the following table, x is the age of a person and y is the weight in pounds.
x, age
21
24
27
29
31
33
35
38
40
42
43
y, weight in lb
121.4
122.3
130.3
131.7
133.3
134.6
136.7
138.4
140.3
142.0
145.1
Select the correct graph of the least-squares line on a scatter diagram.
Chapter 5 Solutions
ESSEN OF BUSINESS ANALYTICS (LL) BOM
Ch. 5 - On-time arrivals, lost baggage, and customer...Ch. 5 - Consider the random experiment of rolling a pair...Ch. 5 - Suppose that for a recent admissions class, an Ivy...Ch. 5 - Suppose that we have two events, A and B, with...Ch. 5 - Students taking the Graduate Management Admissions...Ch. 5 - More than 40 million Americans are estimated to...Ch. 5 - The Human Resources Manager for Optilytics LLC is...Ch. 5 - As was discussed in the Analytics in Action from...Ch. 5 - Cooper Realty is a small real estate company...Ch. 5 - Prob. 10P
Ch. 5 - A local bank reviewed its credit-card policy with...Ch. 5 - RunningWithTheDevil.com created a web site to...Ch. 5 - An oil company purchased an option on land in...Ch. 5 - Suppose the following data represent the number of...Ch. 5 - The percent frequency distributions of job...Ch. 5 - The following table provides a probability...Ch. 5 - The probability distribution for damage claims...Ch. 5 - The J.R. Ryland Computer Company is considering a...Ch. 5 - Prob. 19PCh. 5 - Many companies use a quality control technique...Ch. 5 - Consider a Poisson distribution with .
Write the...Ch. 5 - Emergency 911 calls to a small municipality in...Ch. 5 - A regional director responsible for business...Ch. 5 - The random variable x is known to be uniformly...Ch. 5 - Prob. 26PCh. 5 - Suppose we are interested in bidding on a piece of...Ch. 5 - Prob. 28PCh. 5 - The Siler Construction Company is about to bid on...Ch. 5 - Suppose that the return for a particular large-cap...Ch. 5 - A person must score in the upper 2% of the...Ch. 5 - Assume that the traffic to the web site of Smileys...Ch. 5 - Suppose that Motorola uses the normal distribution...Ch. 5 - Prob. 34PCh. 5 - Prob. 35PCh. 5 - Suppose that the time spent by players in a single...
Knowledge Booster


Learn more about
Need a deep-dive on the concept behind this application? Look no further. Learn more about this topic, statistics and related others by exploring similar questions and additional content below.Similar questions
- Let x be a random variable that represents the percentage of successful free throws a professional basketball player makes in a season. Let y be a random variable that represents the percentage of successful field goals a professional basketball player makes in a season. A random sample of n = 6 professional basketball players gave the following information. x 82 69 73 84 74 64 y 42 48 46 46 46 42 Verify that ∑x =446, ∑y =270, ∑x2 =33,442, ∑y2 =12,180, ∑xy =20,070, and r = 0, and find the critical value for a test using a 5% level of significance claiming that ρis not equal than zero. Round your answer to three decimal places.arrow_forwardLet x be a random variable that represents the percentage of successful free throws a professional basketball player makes in a season. Let y be a random variable that represents the percentage of successful field goals a professional basketball player makes in a season. A random sample of n = 6 professional basketball players gave the following information. x 75 72 75 81 74 81 y 46 39 42 47 49 50 Verify that Se ࣈ 3.591,a ࣈ –10.145, bࣈ0.729, and , and find the predicted percentage of successful field goals for a player with x= 88%successful free throws. Round your answer to the nearest tenth of a percentarrow_forwardAn editor wants to analyze if there is a significant difference in the ratings of books in four different genres. Random samples of book ratings were collected for four different genres. The editor recorded ratings in a 0 to 10 scale in the following table. Fiction Novel Biography Science&Technology 8.5 8.4 6.2 9.1 5.3 5.3 5.5 4.3 7.7 4.2 7.0 9.7 5.1 9.8 9.3 5.2 6.9 8.6 6.7 7.9 4.8 7.1 6.9 8.4 Shall we reject or not reject the claim that there are no differences among the population means of book ratings for the different genres? Use.arrow_forward
- Peggy conducted a study to identify the randomness of rainy days in fall. For 15 days, she recorded whether it rained that day or not. They denoted a rainy day with the letter R, a day without rain with the letter N. R N N R R N N R R N N R R R R Test the sequence for randomness. Use .arrow_forwardConsider the grades for the math and history exams for 10 students on a scale from 0 to 12 in the following table. Student Math History 1 4 8 2 5 9 3 7 9 4 12 10 5 10 8 6 8 5 7 9 6 8 9 6 9 11 9 10 7 10 Compute the Spearman correlation coefficient. Round your answer to three decimal places.arrow_forwardTo compare two elementary schools regarding teaching of reading skills, 12 sets of identical twins were used. In each case, one child was selected at random and sent to school A, and his or her twin was sent to school B. Near the end of fifth grade, an achievement test was given to each child. The results follow: Twin Pair 1 2 3 4 5 6 School A 169 157 115 99 119 113 School B 123 157 112 99 121 122 Twin Pair 7 8 9 10 11 12 School A 120 121 124 145 138 117 School B 153 90 124 140 142 102 Suppose a sign test for matched pairs with a 1% level of significance is used to test the hypothesis that the schools have the same effectiveness in teaching reading skills against the alternate hypothesis that the schools have different levels of effectiveness in teaching reading skills. Let p denote portion of positive signs when the scores of school B are subtracted from the corresponding scores of school…arrow_forward
- A horse trainer teaches horses to jump by using two methods of instruction. Horses being taught by method A have a lead horse that accompanies each jump. Horses being taught by method B have no lead horse. The table shows the number of training sessions required before each horse performed the jumps properly. Method A 25 23 39 29 37 20 Method B 41 21 46 42 24 44 Method A 45 35 27 31 34 49 Method B 26 43 47 32 40 Use a rank-sum test with a5% level of significance to test the claim that there is no difference between the training sessions distributions. If the value of the sample test statistic R, the rank-sum, is 150, calculate the P-value. Round your answer to four decimal places.arrow_forwardA data processing company has a training program for new salespeople. After completing the training program, each trainee is ranked by his or her instructor. After a year of sales, the same class of trainees is again ranked by a company supervisor according to net value of the contracts they have acquired for the company. The results for a random sample of 11 salespeople trained in the last year follow, where x is rank in training class and y is rank in sales after 1 year. Lower ranks mean higher standing in class and higher net sales. Person 1 2 3 4 5 6 x rank 8 11 2 4 5 3 y rank 7 10 1 3 2 4 Person 7 8 9 10 11 x rank 7 9 10 1 6 y rank 8 11 9 6 5 Using a 1% level of significance, test the claim that the relation between x and y is monotone (either increasing or decreasing). Verify that the Spearman rank correlation coefficient . This implies that the P-value lies between 0.002 and 0.01. State…arrow_forwardSand and clay studies were conducted at a site in California. Twelve consecutive depths, each about 15 cm deep, were studied and the following percentages of sand in the soil were recorded. 34.4 27.1 30.8 28.0 32.2 27.6 32.8 25.2 31.4 33.5 24.7 28.4 Converting this sequence of numbers to a sequence of symbols A and B, where A indicates a value above the median and B denotes a value below the median gives ABABABABAABB. Test the sequence for randomness about the median with a 5% level of significance. Verify that the number of runs is 10. What is the upper critical value c2? arrow_forward
- Sand and clay studies were conducted at a site in California. Twelve consecutive depths, each about 15 cm deep, were studied and the following percentages of sand in the soil were recorded. 34.4 27.1 30.8 28.0 32.2 27.6 32.8 25.2 31.4 33.5 24.7 28.4 Converting this sequence of numbers to a sequence of symbols A and B, where A indicates a value above the median and B denotes a value below the median gives ABABABABAABB. Test the sequence for randomness about the median with a 5% level of significance. Verify that the number of runs is 10. What is the upper critical value c2?arrow_forward29% of all college students major in STEM (Science, Technology, Engineering, and Math). If 46 college students are randomly selected, find the probability thata. Exactly 11 of them major in STEM. b. At most 12 of them major in STEM. c. At least 11 of them major in STEM. d. Between 11 and 15 (including 11 and 15) of them major in STEM.arrow_forwardSand and clay studies were conducted at a site in California. Twelve consecutive depths, each about 15 cm deep, were studied and the following percentages of sand in the soil were recorded. 27.3 34.6 30.6 27.8 33.4 31.5 27.3 31.2 32.0 24.7 24.4 28.2 Test this sequence for randomness about the median. Converting this sequence of numbers to a sequence of symbols A and B, where A indicates a value above the median and B denotes a value below the median gives BAABAABAABBB. Verify that the number of runs is 7, the lower critical number is 3, and the upper critical number is 11. Use a 5% level of significance. State the conclusion of the test and interpret your results.arrow_forward
arrow_back_ios
SEE MORE QUESTIONS
arrow_forward_ios
Recommended textbooks for you
 Glencoe Algebra 1, Student Edition, 9780079039897...AlgebraISBN:9780079039897Author:CarterPublisher:McGraw Hill

Glencoe Algebra 1, Student Edition, 9780079039897...
Algebra
ISBN:9780079039897
Author:Carter
Publisher:McGraw Hill
How to make Frequency Distribution Table / Tally Marks and Frequency Distribution Table; Author: Reenu Math;https://www.youtube.com/watch?v=i_A6RiE8tLE;License: Standard YouTube License, CC-BY
Frequency distribution table in statistics; Author: Math and Science;https://www.youtube.com/watch?v=T7KYO76DoOE;License: Standard YouTube License, CC-BY
Frequency Distribution Table for Grouped/Continuous data | Math Dot Com; Author: Maths dotcom;https://www.youtube.com/watch?v=ErnccbXQOPY;License: Standard Youtube License