Climate Change and Political Party In 2016 a Pew Research poll asked a sample of Americans if they agreed with this statement: The Earth is warming mostly due to human activity. Responses and the political affiliation of respondents were recorded and are shown in the following table. a. Fill in the row and column totals for the table. b. If one person is chosen randomly from the group, what is the probability that the person is a Conservative Republican? c. If one person is chosen randomly from the group, what is the probability that the person agrees with the statement?
Climate Change and Political Party In 2016 a Pew Research poll asked a sample of Americans if they agreed with this statement: The Earth is warming mostly due to human activity. Responses and the political affiliation of respondents were recorded and are shown in the following table. a. Fill in the row and column totals for the table. b. If one person is chosen randomly from the group, what is the probability that the person is a Conservative Republican? c. If one person is chosen randomly from the group, what is the probability that the person agrees with the statement?
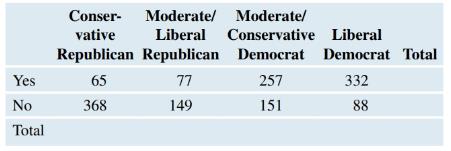
Solution Summary: The author explains the two-way table with counts that shows the responses and the political affiliation of respondents in a Pew research poll.
Climate Change and Political Party In 2016 a Pew Research poll asked a sample of Americans if they agreed with this statement: The Earth is warming mostly due to human activity. Responses and the political affiliation of respondents were recorded and are shown in the following table.
a. Fill in the row and column totals for the table.
b. If one person is chosen randomly from the group, what is the probability that the person is a
Conservative Republican?
c. If one person is chosen randomly from the group, what is the probability that the person agrees
NC Current Students - North Ce X | NC Canvas Login Links - North ( X
Final Exam Comprehensive x Cengage Learning
x
WASTAT - Final Exam - STAT
→
C
webassign.net/web/Student/Assignment-Responses/submit?dep=36055360&tags=autosave#question3659890_9
Part (b)
Draw a scatter plot of the ordered pairs.
N
Life
Expectancy
Life
Expectancy
80
70
600
50
40
30
20
10
Year of
1950
1970 1990
2010 Birth
O
Life
Expectancy
Part (c)
800
70
60
50
40
30
20
10
1950
1970 1990
W
ALT
林
$
#
4
R
J7
Year of
2010 Birth
F6
4+
80
70
60
50
40
30
20
10
Year of
1950 1970 1990
2010 Birth
Life
Expectancy
Ox
800
70
60
50
40
30
20
10
Year of
1950 1970 1990 2010 Birth
hp
P.B.
KA
&
7
80
% 5
H
A
B
F10
711
N
M
K
744
PRT SC
ALT
CTRL
Harvard University
California Institute of Technology
Massachusetts Institute of Technology
Stanford University
Princeton University
University of Cambridge
University of Oxford
University of California, Berkeley
Imperial College London
Yale University
University of California, Los Angeles
University of Chicago
Johns Hopkins University
Cornell University
ETH Zurich
University of Michigan
University of Toronto
Columbia University
University of Pennsylvania
Carnegie Mellon University
University of Hong Kong
University College London
University of Washington
Duke University
Northwestern University
University of Tokyo
Georgia Institute of Technology
Pohang University of Science and Technology
University of California, Santa Barbara
University of British Columbia
University of North Carolina at Chapel Hill
University of California, San Diego
University of Illinois at Urbana-Champaign
National University of Singapore
McGill…
Name
Harvard University
California Institute of Technology
Massachusetts Institute of Technology
Stanford University
Princeton University
University of Cambridge
University of Oxford
University of California, Berkeley
Imperial College London
Yale University
University of California, Los Angeles
University of Chicago
Johns Hopkins University
Cornell University
ETH Zurich
University of Michigan
University of Toronto
Columbia University
University of Pennsylvania
Carnegie Mellon University
University of Hong Kong
University College London
University of Washington
Duke University
Northwestern University
University of Tokyo
Georgia Institute of Technology
Pohang University of Science and Technology
University of California, Santa Barbara
University of British Columbia
University of North Carolina at Chapel Hill
University of California, San Diego
University of Illinois at Urbana-Champaign
National University of Singapore…
Elementary Statistics ( 3rd International Edition ) Isbn:9781260092561
Knowledge Booster
Learn more about
Need a deep-dive on the concept behind this application? Look no further. Learn more about this topic, statistics and related others by exploring similar questions and additional content below.


 Holt Mcdougal Larson Pre-algebra: Student Edition...AlgebraISBN:9780547587776Author:HOLT MCDOUGALPublisher:HOLT MCDOUGAL
 College AlgebraAlgebraISBN:9781305115545Author:James Stewart, Lothar Redlin, Saleem WatsonPublisher:Cengage Learning
 Algebra and Trigonometry (MindTap Course List)AlgebraISBN:9781305071742Author:James Stewart, Lothar Redlin, Saleem WatsonPublisher:Cengage Learning
 Glencoe Algebra 1, Student Edition, 9780079039897...AlgebraISBN:9780079039897Author:CarterPublisher:McGraw Hill