Use the graph of f in the figure to identify the following (assume that f" (0) < 0 f" ( b ) > 0, and f" ( g ) > 0): (A) the intervals on which f' ( x ) <0 (B) the intervals on which f' ( x ) > 0 (C) the intervals on which f ( x ) is increasing (D) the intervals on which f ( x ) is decreasing (E) the .v coordinate(s) of the point(s) where f ( x ) has a local maximum (F) the x coordinate(s) of the point(s) where f ( x ) has a local minimum (G) the intervals on which f" ( x ) < 0 (H) the intervals on which f" ( x ) > 0 (I) the intervals on which the graph of f is concave upward (J) the intervals on which the graph of f is concave downward (K) the .v coordinate(s) of the inflection point(s) (L) the horizontal asymptote(s) (M) the vertical asymptote(s)
Use the graph of f in the figure to identify the following (assume that f" (0) < 0 f" ( b ) > 0, and f" ( g ) > 0): (A) the intervals on which f' ( x ) <0 (B) the intervals on which f' ( x ) > 0 (C) the intervals on which f ( x ) is increasing (D) the intervals on which f ( x ) is decreasing (E) the .v coordinate(s) of the point(s) where f ( x ) has a local maximum (F) the x coordinate(s) of the point(s) where f ( x ) has a local minimum (G) the intervals on which f" ( x ) < 0 (H) the intervals on which f" ( x ) > 0 (I) the intervals on which the graph of f is concave upward (J) the intervals on which the graph of f is concave downward (K) the .v coordinate(s) of the inflection point(s) (L) the horizontal asymptote(s) (M) the vertical asymptote(s)
Solution Summary: The author analyzes the function y=f(x), f's decreasing in a given interval, and the value of '0.
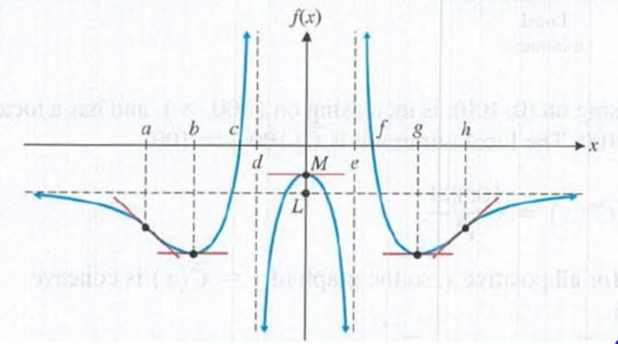
Use the graph of f in the figure to identify the following (assume that f"(0) < 0 f"(b) > 0, and f"(g) > 0):
(A) the intervals on which f'(x)<0
(B) the intervals on which f'(x) > 0
(C) the intervals on which f(x) is increasing
(D) the intervals on which f(x) is decreasing
(E) the .v coordinate(s) of the point(s) where f (x) has a local maximum
(F) the x coordinate(s) of the point(s) where f(x) has a local minimum
(G) the intervals on which f"(x) < 0
(H) the intervals on which f"(x) > 0
(I) the intervals on which the graph of f is concave upward
(J) the intervals on which the graph of f is concave downward
(K) the .v coordinate(s) of the inflection point(s)
(L) the horizontal asymptote(s)
(M) the vertical asymptote(s)
Formula Formula A function f(x) attains a local maximum at x=a , if there exists a neighborhood (a−δ,a+δ) of a such that, f(x)<f(a), ∀ x∈(a−δ,a+δ),x≠a f(x)−f(a)<0, ∀ x∈(a−δ,a+δ),x≠a In such case, f(a) attains a local maximum value f(x) at x=a .
draw the graph of a function for which f' and f'' take on the given sign combinations. ++, +−, −−
Sketch the graph of a function y = x".
x*.
Consider the function f(x)=x/x^2+12x+32.
Determine the intervals on which f is increasing and decreasing. Your answer should either be a single interval, such as "(0,1)", a comma separated list of intervals, such as "(-inf, 2), (3,4)" , or the word "none".
Need a deep-dive on the concept behind this application? Look no further. Learn more about this topic, subject and related others by exploring similar questions and additional content below.
Differential Equation | MIT 18.01SC Single Variable Calculus, Fall 2010; Author: MIT OpenCourseWare;https://www.youtube.com/watch?v=HaOHUfymsuk;License: Standard YouTube License, CC-BY


 Algebra: Structure And Method, Book 1AlgebraISBN:9780395977224Author:Richard G. Brown, Mary P. Dolciani, Robert H. Sorgenfrey, William L. ColePublisher:McDougal Littell
 College Algebra (MindTap Course List)AlgebraISBN:9781305652231Author:R. David Gustafson, Jeff HughesPublisher:Cengage Learning
 College AlgebraAlgebraISBN:9781305115545Author:James Stewart, Lothar Redlin, Saleem WatsonPublisher:Cengage Learning
 Algebra & Trigonometry with Analytic GeometryAlgebraISBN:9781133382119Author:SwokowskiPublisher:Cengage