Use the graph of f in the figure to identify the following (assume that f" (0) < 0 f" ( b ) > 0, and f" ( g ) > 0): (A) the intervals on which f' ( x ) <0 (B) the intervals on which f' ( x ) > 0 (C) the intervals on which f ( x ) is increasing (D) the intervals on which f ( x ) is decreasing (E) the .v coordinate(s) of the point(s) where f ( x ) has a local maximum (F) the x coordinate(s) of the point(s) where f ( x ) has a local minimum (G) the intervals on which f" ( x ) < 0 (H) the intervals on which f" ( x ) > 0 (I) the intervals on which the graph of f is concave upward (J) the intervals on which the graph of f is concave downward (K) the .v coordinate(s) of the inflection point(s) (L) the horizontal asymptote(s) (M) the vertical asymptote(s)
Use the graph of f in the figure to identify the following (assume that f" (0) < 0 f" ( b ) > 0, and f" ( g ) > 0): (A) the intervals on which f' ( x ) <0 (B) the intervals on which f' ( x ) > 0 (C) the intervals on which f ( x ) is increasing (D) the intervals on which f ( x ) is decreasing (E) the .v coordinate(s) of the point(s) where f ( x ) has a local maximum (F) the x coordinate(s) of the point(s) where f ( x ) has a local minimum (G) the intervals on which f" ( x ) < 0 (H) the intervals on which f" ( x ) > 0 (I) the intervals on which the graph of f is concave upward (J) the intervals on which the graph of f is concave downward (K) the .v coordinate(s) of the inflection point(s) (L) the horizontal asymptote(s) (M) the vertical asymptote(s)
Solution Summary: The author analyzes the function y=f(x), f's decreasing in a given interval, and the value of '0.
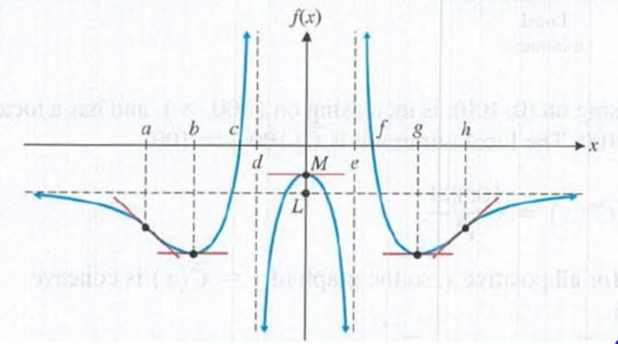
Use the graph of f in the figure to identify the following (assume that f"(0) < 0 f"(b) > 0, and f"(g) > 0):
(A) the intervals on which f'(x)<0
(B) the intervals on which f'(x) > 0
(C) the intervals on which f(x) is increasing
(D) the intervals on which f(x) is decreasing
(E) the .v coordinate(s) of the point(s) where f (x) has a local maximum
(F) the x coordinate(s) of the point(s) where f(x) has a local minimum
(G) the intervals on which f"(x) < 0
(H) the intervals on which f"(x) > 0
(I) the intervals on which the graph of f is concave upward
(J) the intervals on which the graph of f is concave downward
(K) the .v coordinate(s) of the inflection point(s)
(L) the horizontal asymptote(s)
(M) the vertical asymptote(s)
Formula Formula A function f(x) attains a local maximum at x=a , if there exists a neighborhood (a−δ,a+δ) of a such that, f(x)<f(a), ∀ x∈(a−δ,a+δ),x≠a f(x)−f(a)<0, ∀ x∈(a−δ,a+δ),x≠a In such case, f(a) attains a local maximum value f(x) at x=a .
Determine if the set of vectors is linearly independent or linearly dependent.
linearly independent
O linearly dependent
Save Answer
Q2.2
1 Point
Determine if the set of vectors spans R³.
they span R³
they do not span R³
Save Answer
23
Q2.3
1 Point
Determine if the set of vectors is linearly independent or linearly dependent.
linearly independent
O linearly dependent
Save Answer
1111
1110
Q2.4
1 Point
Determine if the set of vectors spans R4.
O they span R4
they do not span IR4
1000;
111O'
The everything combined problem
Suppose that a computer science laboratory has 15 workstations and 10 servers. A cable can be used to
directly connect a workstation to a server. For each server, only one direct connection to that server can be
active at any time.
1. How many cables would you need to connect each station to each server?
2. How many stations can be used at one time?
3. How many stations can not be used at any one time?
4. How many ways are there to pick 10 stations out of 15?
5. (This one is tricky) We want to guarantee that at any time any set of 10 or fewer workstations can
simultaneously access different servers via direct connections. What is the minimum number of direct
connections needed to achieve this goal?
Need a deep-dive on the concept behind this application? Look no further. Learn more about this topic, calculus and related others by exploring similar questions and additional content below.
Differential Equation | MIT 18.01SC Single Variable Calculus, Fall 2010; Author: MIT OpenCourseWare;https://www.youtube.com/watch?v=HaOHUfymsuk;License: Standard YouTube License, CC-BY


 Algebra & Trigonometry with Analytic GeometryAlgebraISBN:9781133382119Author:SwokowskiPublisher:Cengage
 College Algebra (MindTap Course List)AlgebraISBN:9781305652231Author:R. David Gustafson, Jeff HughesPublisher:Cengage Learning
 College AlgebraAlgebraISBN:9781305115545Author:James Stewart, Lothar Redlin, Saleem WatsonPublisher:Cengage Learning
 Algebra: Structure And Method, Book 1AlgebraISBN:9780395977224Author:Richard G. Brown, Mary P. Dolciani, Robert H. Sorgenfrey, William L. ColePublisher:McDougal Littell