
a.
To graph: A
Given information:
Scatter plot for the function is
The intervals given are
Calculation:
The given points are,
Now to form a table data for
Graph:
Plotting the
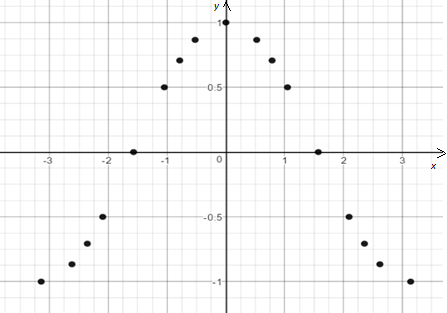
Interpretation:
A graph for the scatter plot
b.
To find: The quadratic regression for the data.
The quadratic regression for the data is
Given information:
Scatter plot for the function is
The intervals given are
Calculation:
The given points are,
Now to form a table data for
To determine the quadratic regression for the data
Taking the parameters from the above table,
Substituting the above parameters in the expression to get,
Therefore, the quadratic regression for the data is
c.
To compare: The approximation to the cosine function given by the cubic expression with the Taylor polynomial approximations.
The results are same when comparing the approximation to the cosine function given by the cubic expression with the Taylor polynomial approximations.
Given information:
Scatter plot for the function is
The intervals given are
Calculation:
From part (b), the quadratic regression is given by,
Taking 3 decimals approximately,
The Taylor polynomial expression is given by,
Therefore, the cubic regression of the cosine function and the Taylor’s approximation has the same results.
Chapter 4 Solutions
Precalculus: Graphical, Numerical, Algebraic Common Core 10th Edition

- Fig. 4.22. Problems 4.1 (A). Determine the second moments of area about the axes XX for the sections shown in Fig. 4.23. [15.69, 7.88, 41.15, 24; all x 10-6 m. All dimensions in mm IAA inn 100 25 50 25 50 80 50 50 Fig. 4.23. X 80 60arrow_forward4.3 (A). A conveyor beam has the cross-section shown in Fig. 4.24 and it is subjected to a bending moment in the plane YY. Determine the maximum permissible bending moment which can be applied to the beam (a) for bottom flange in tension, and (b) for bottom flange in compression, if the safe stresses for the material in tension and compression are 30 MN/m² and 150 MN/m² respectively. Y [32.3, 84.8 kNm.] 150 100 50 -25 +50-50-50-50- All dimensions in mmarrow_forward"Find the values of V1, V2, and V3 by solving the following differential equation system:" 1 L1 1 X - X x 2 - 2x x2 x3 x² - 4x + 2] M Larrow_forward
- 1. Consider the function f(x) whose graph is given below. Use the graph to determine the following: 2 a) All x for which f'(x) is positive. b) All x for which f'(x) is negative. 2 -2 c) The x for which f'(x) is zero. (please depict this on the graph)arrow_forward4. Suppose that the population of a certain collection of rare Brazilian ants is given by P(t)=(t+100) In(t+2), Where t represents the time in days. Find and interpret the rates of change of the population on the third day and on the tenth day.arrow_forwardFind all values of x for f (x)=(x²-4) 4 where the tangent line is horizontal. 5. Find the slope of the tangent line to the graph of f(x)=-√8x+1 at x=1. Write the equation of the tangent line.arrow_forward
- 3. Find the derivative of each function. Label with appropriate derivative notation showing both dependent and independent variables. f(t)=4t(2t⭑+4)³ a. f(t)=4t (2t+4)³ (Answer must be factored.) b. y= 3 1 (2x³-4) 6arrow_forward4.3 The Chain Rule 1. {Algebra review} Let f(x)=2x²-5 x and g(x)=6x+2. Find f[g(−5)]. 2. {Algebra review} Write h(x)=√√8x-3 as the composite of two functions f(x) and g(x). (There may be more than one way to do this.)arrow_forward4.4 Derivatives of Exponential Functions 1. Find derivatives of the functions defined as follows. a. g(t)=-3.4e b. y=e√x c. f(x)=(4x³+2)e³* d. y=- x²arrow_forward
- 4.5 Derivatives of Logarithmic Functions 1. Find the derivative of each function. a) y=ln (-3x) b) f(u)=nu c) 9(x)=x-1 lnxarrow_forward3. If the total revenue received from the sale of x items is given by R(x)=30ln (2x+1), While the total cost to produce x items is C(x)=✗, find the following. a) The marginal revenue b) The profit function P(x) (Hint: P(x)=R(x)-C(x)} c) The marginal profit when x=20 d) Interpret the results of part c).arrow_forward2. The sales of a new personal computer (in thousands) are given by S(t)=100-90€-04: Where t represents time in years. Find and interpret the rate of change of sales at each time. a) After 1 year b) After 5 years c) What is happening to the rate of change of sales as time goes on? d) Does the rate of change of sales ever equal zero?arrow_forward
 Calculus: Early TranscendentalsCalculusISBN:9781285741550Author:James StewartPublisher:Cengage Learning
 Thomas' Calculus (14th Edition)CalculusISBN:9780134438986Author:Joel R. Hass, Christopher E. Heil, Maurice D. WeirPublisher:PEARSON
 Calculus: Early Transcendentals (3rd Edition)CalculusISBN:9780134763644Author:William L. Briggs, Lyle Cochran, Bernard Gillett, Eric SchulzPublisher:PEARSON
 Calculus: Early TranscendentalsCalculusISBN:9781319050740Author:Jon Rogawski, Colin Adams, Robert FranzosaPublisher:W. H. Freeman
 Calculus: Early Transcendental FunctionsCalculusISBN:9781337552516Author:Ron Larson, Bruce H. EdwardsPublisher:Cengage Learning