
EBK STATISTICS FOR BUSINESS & ECONOMICS
12th Edition
ISBN: 8220100460463
Author: Anderson
Publisher: CENGAGE L
expand_more
expand_more
format_list_bulleted
Concept explainers
Videos
Textbook Question
Chapter 4.4, Problem 32E
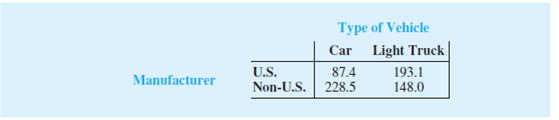
The automobile industry sold 657,000 vehicles in the United States during January 2009 (The Wall Street Journal, February 4, 2009). This volume was down 37% from January 2008 as economic conditions continued to decline. The big Three U.S. automakers—General Motors, Ford, and Chrysler—sold 280,500 vehicles, down 48% from January 2008. A summary of sales by automobile manufacturer and type of vehicle sold is shown in the following table. Data are in thousands of vehicles. The non-U.S. manufacturers are led by Toyota, Honda, and Nissan. The category light Truck includes pickup, minivan, SUV, and crossover models.
- a. Develop a joint
probability table for these data and use the table to answer the remaining questions. - b. What are the marginal probabilities? What do they tell you about the probabilities associated with the manufacturer and the type of vehicle sold?
- c. If a vehicle was manufactured by one of the U.S. automakers, what is the probability that the vehicle was a car? What is the probability it was a light truck?
- d. If a vehicle was not manufactured by one of the U.S. automakers, what is the probability that the vehicle was a car? What is the probability it was a light truck?
- e. If the vehicle was a light truck, what is the probability that it was manufactured by one of the U.S. automakers?
- f. What does the probability information tell you about sales?
Expert Solution & Answer

Trending nowThis is a popular solution!

Students have asked these similar questions
mean trough level of the population to be 3.7 micrograms/mL. The researcher conducts a study among 93 newly diagnosed arthritis patients and finds the mean trough to be 4.1 micrograms/mL with a standard deviation of 2.4 micrograms/mL. The researcher wants to test at the 5% level of significance if the trough is different than previously reported or not. Z statistics will be used.
Complete Step 5 of hypothesis testing: Conclusion. State whether or not you would reject the null hypothesis and why. Also interpret what this means (i.e. is the mean trough different from 3.7 or no
30% of all college students major in STEM (Science, Technology, Engineering, and Math). If 48 college students are randomly selected, find the probability thata. Exactly 12 of them major in STEM. b. At most 17 of them major in STEM. c. At least 12 of them major in STEM. d. Between 9 and 13 (including 9 and 13) of them major in STEM.
7% of all Americans live in poverty. If 40 Americans are randomly selected, find the probability thata. Exactly 4 of them live in poverty. b. At most 1 of them live in poverty. c. At least 1 of them live in poverty. d. Between 2 and 9 (including 2 and 9) of them live in poverty.
Chapter 4 Solutions
EBK STATISTICS FOR BUSINESS & ECONOMICS
Ch. 4.1 - An experiment has three steps with three outcomes...Ch. 4.1 - How many ways can three items be selected from a...Ch. 4.1 - How many permutations of three items can be...Ch. 4.1 - Consider the experiment of tossing a coin three...Ch. 4.1 - Suppose an experiment has five equally likely...Ch. 4.1 - An experiment with three outcomes has been...Ch. 4.1 - A decision maker subjectively assigned the...Ch. 4.1 - In the city of Milford, applications for zoning...Ch. 4.1 - Simple random sampling uses a sample of size n...Ch. 4.1 - Many students accumulate debt by the time they...
Ch. 4.1 - The National Occupant Protection Use Survey...Ch. 4.1 - The Powerball lottery is played twice each week in...Ch. 4.1 - A company that manufactures toothpaste is studying...Ch. 4.2 - An experiment has four equally likely outcomes:...Ch. 4.2 - Consider the experiment of selecting a playing...Ch. 4.2 - Consider the experiment of rolling a pair of dice....Ch. 4.2 - Refer to the KPL sample points and sample point...Ch. 4.2 - To investigate how often families eat at home,...Ch. 4.2 - Do you think the government protects investors...Ch. 4.2 - Fortune magazine publishes an annual list of the...Ch. 4.2 - Data on U.S. work-related fatalities by cause...Ch. 4.3 - Suppose that we have a sample space with five...Ch. 4.3 - Suppose that we have a sample space S = {E1, E2,...Ch. 4.3 - Clarkson University surveyed alumni to learn more...Ch. 4.3 - The U.S. Census Bureau provides data on the number...Ch. 4.3 - Information about mutual funds provided by...Ch. 4.3 - What NCAA college basketball conferences have the...Ch. 4.3 - A survey of magazine subscribers showed that 45.8%...Ch. 4.3 - High school seniors with strong academic records...Ch. 4.4 - Suppose that we have two events, A and B, with...Ch. 4.4 - Assume that we have two events, A and B, that are...Ch. 4.4 - The automobile industry sold 657,000 vehicles in...Ch. 4.4 - Students taking the Graduate Management Admissions...Ch. 4.4 - The U.S. Department of Transportation reported...Ch. 4.4 - According to the Ameriprise Financial Money Across...Ch. 4.4 - Jamal Crawford of the National Basketball...Ch. 4.4 - Visa Card USA studied how frequently young...Ch. 4.4 - Students in grades 3 through 8 in New York State...Ch. 4.5 - The prior probabilities for events A1 and A2 are...Ch. 4.5 - The prior probabilities for events A1, A2, and A3...Ch. 4.5 - A consulting firm submitted a bid for a large...Ch. 4.5 - A local bank reviewed its credit card policy with...Ch. 4.5 - Two Wharton professors analyzed 1,613,234 putts by...Ch. 4.5 - According to the Open Doors 2011 Report, 9.5% of...Ch. 4.5 - In an article about investment alternatives, Money...Ch. 4 - The Wall Street Journal/Harris Personal Finance...Ch. 4 - A financial manager made two new investmentsone in...Ch. 4 - Forty-three percent of Americans use social media...Ch. 4 - A study of 31,000 hospital admissions in New York...Ch. 4 - A telephone survey to determine viewer response to...Ch. 4 - The following crosstabulation shows household...Ch. 4 - An MBA new-matriculants survey provided the...Ch. 4 - Refer again to the data from the MBA...Ch. 4 - In February 2012, the Pew Internet American Life...Ch. 4 - A large consumer goods company ran a television...Ch. 4 - Cooper Realty is a small real estate company...Ch. 4 - A company studied the number of lost-time...Ch. 4 - A survey showed that 8% of Internet users age 18...Ch. 4 - An oil company purchased an option on land in...Ch. 4 - The five most common words appearing in spam...Ch. 4 - Hamilton County Judges Hamilton County judges try...
Knowledge Booster


Learn more about
Need a deep-dive on the concept behind this application? Look no further. Learn more about this topic, statistics and related others by exploring similar questions and additional content below.Similar questions
- 48% of all violent felons in the prison system are repeat offenders. If 40 violent felons are randomly selected, find the probability that a. Exactly 18 of them are repeat offenders. b. At most 18 of them are repeat offenders. c. At least 18 of them are repeat offenders. d. Between 17 and 21 (including 17 and 21) of them are repeat offenders.arrow_forwardConsider an MA(6) model with θ1 = 0.5, θ2 = −25, θ3 = 0.125, θ4 = −0.0625, θ5 = 0.03125, and θ6 = −0.015625. Find a much simpler model that has nearly the same ψ-weights.arrow_forwardLet {Yt} be an AR(2) process of the special form Yt = φ2Yt − 2 + et. Use first principles to find the range of values of φ2 for which the process is stationary.arrow_forward
- Describe the important characteristics of the autocorrelation function for the following models: (a) MA(1), (b) MA(2), (c) AR(1), (d) AR(2), and (e) ARMA(1,1).arrow_forward« CENGAGE MINDTAP Quiz: Chapter 38 Assignment: Quiz: Chapter 38 ips Questions ra1kw08h_ch38.15m 13. 14. 15. O Which sentence has modifiers in the correct place? O a. When called, she for a medical emergency responds quickly. b. Without giving away too much of the plot, Helena described the heroine's actions in the film. O c. Nearly the snakebite victim died before the proper antitoxin was injected. . O O 16 16. O 17. 18. O 19. O 20 20. 21 21. 22. 22 DS 23. 23 24. 25. O O Oarrow_forwardQuestions ra1kw08h_ch36.14m 12. 13. 14. 15. 16. Ӧ 17. 18. 19. OS 20. Two separate sentences need Oa. two separate subjects. Ob. two dependent clauses. c. one shared subject.arrow_forward
- Customers experiencing technical difficulty with their Internet cable service may call an 800 number for technical support. It takes the technician between 30 seconds and 11 minutes to resolve the problem. The distribution of this support time follows the uniform distribution. Required: a. What are the values for a and b in minutes? Note: Do not round your intermediate calculations. Round your answers to 1 decimal place. b-1. What is the mean time to resolve the problem? b-2. What is the standard deviation of the time? c. What percent of the problems take more than 5 minutes to resolve? d. Suppose we wish to find the middle 50% of the problem-solving times. What are the end points of these two times?arrow_forwardExercise 6-6 (Algo) (LO6-3) The director of admissions at Kinzua University in Nova Scotia estimated the distribution of student admissions for the fall semester on the basis of past experience. Admissions Probability 1,100 0.5 1,400 0.4 1,300 0.1 Click here for the Excel Data File Required: What is the expected number of admissions for the fall semester? Compute the variance and the standard deviation of the number of admissions. Note: Round your standard deviation to 2 decimal places.arrow_forward1. Find the mean of the x-values (x-bar) and the mean of the y-values (y-bar) and write/label each here: 2. Label the second row in the table using proper notation; then, complete the table. In the fifth and sixth columns, show the 'products' of what you're multiplying, as well as the answers. X y x minus x-bar y minus y-bar (x minus x-bar)(y minus y-bar) (x minus x-bar)^2 xy 16 20 34 4-2 5 2 3. Write the sums that represents Sxx and Sxy in the table, at the bottom of their respective columns. 4. Find the slope of the Regression line: bi = (simplify your answer) 5. Find the y-intercept of the Regression line, and then write the equation of the Regression line. Show your work. Then, BOX your final answer. Express your line as "y-hat equals...arrow_forward
- Apply STATA commands & submit the output for each question only when indicated below i. Generate the log of birthweight and family income of children. Name these new variables Ibwght & Ifaminc. Include the output of this code. ii. Apply the command sum with the detail option to the variable faminc. Note: you should find the 25th percentile value, the 50th percentile and the 75th percentile value of faminc from the output - you will need it to answer the next question Include the output of this code. iii. iv. Use the output from part ii of this question to Generate a variable called "high_faminc" that takes a value 1 if faminc is less than or equal to the 25th percentile, it takes the value 2 if faminc is greater than 25th percentile but less than or equal to the 50th percentile, it takes the value 3 if faminc is greater than 50th percentile but less than or equal to the 75th percentile, it takes the value 4 if faminc is greater than the 75th percentile. Include the outcome of this code…arrow_forwardsolve this on paperarrow_forwardApply STATA commands & submit the output for each question only when indicated below i. Apply the command egen to create a variable called "wyd" which is the rowtotal function on variables bwght & faminc. ii. Apply the list command for the first 10 observations to show that the code in part i worked. Include the outcome of this code iii. Apply the egen command to create a new variable called "bwghtsum" using the sum function on variable bwght by the variable high_faminc (Note: need to apply the bysort' statement) iv. Apply the "by high_faminc" statement to find the V. descriptive statistics of bwght and bwghtsum Include the output of this code. Why is there a difference between the standard deviations of bwght and bwghtsum from part iv of this question?arrow_forward
arrow_back_ios
SEE MORE QUESTIONS
arrow_forward_ios
Recommended textbooks for you
 Glencoe Algebra 1, Student Edition, 9780079039897...AlgebraISBN:9780079039897Author:CarterPublisher:McGraw Hill
 Algebra: Structure And Method, Book 1AlgebraISBN:9780395977224Author:Richard G. Brown, Mary P. Dolciani, Robert H. Sorgenfrey, William L. ColePublisher:McDougal Littell
 Holt Mcdougal Larson Pre-algebra: Student Edition...AlgebraISBN:9780547587776Author:HOLT MCDOUGALPublisher:HOLT MCDOUGAL
 College Algebra (MindTap Course List)AlgebraISBN:9781305652231Author:R. David Gustafson, Jeff HughesPublisher:Cengage Learning
 Functions and Change: A Modeling Approach to Coll...AlgebraISBN:9781337111348Author:Bruce Crauder, Benny Evans, Alan NoellPublisher:Cengage Learning
 Big Ideas Math A Bridge To Success Algebra 1: Stu...AlgebraISBN:9781680331141Author:HOUGHTON MIFFLIN HARCOURTPublisher:Houghton Mifflin Harcourt
Glencoe Algebra 1, Student Edition, 9780079039897...
Algebra
ISBN:9780079039897
Author:Carter
Publisher:McGraw Hill
Algebra: Structure And Method, Book 1
Algebra
ISBN:9780395977224
Author:Richard G. Brown, Mary P. Dolciani, Robert H. Sorgenfrey, William L. Cole
Publisher:McDougal Littell
Holt Mcdougal Larson Pre-algebra: Student Edition...
Algebra
ISBN:9780547587776
Author:HOLT MCDOUGAL
Publisher:HOLT MCDOUGAL
College Algebra (MindTap Course List)
Algebra
ISBN:9781305652231
Author:R. David Gustafson, Jeff Hughes
Publisher:Cengage Learning
Functions and Change: A Modeling Approach to Coll...
Algebra
ISBN:9781337111348
Author:Bruce Crauder, Benny Evans, Alan Noell
Publisher:Cengage Learning
Big Ideas Math A Bridge To Success Algebra 1: Stu...
Algebra
ISBN:9781680331141
Author:HOUGHTON MIFFLIN HARCOURT
Publisher:Houghton Mifflin Harcourt
Correlation Vs Regression: Difference Between them with definition & Comparison Chart; Author: Key Differences;https://www.youtube.com/watch?v=Ou2QGSJVd0U;License: Standard YouTube License, CC-BY
Correlation and Regression: Concepts with Illustrative examples; Author: LEARN & APPLY : Lean and Six Sigma;https://www.youtube.com/watch?v=xTpHD5WLuoA;License: Standard YouTube License, CC-BY