Concept explainers
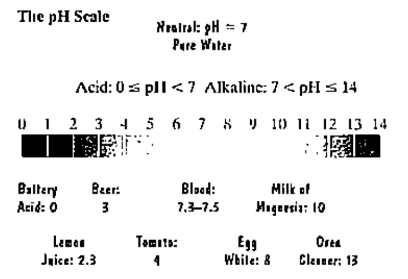
The pH scale is used to measure the acidity or alkalinity of a solution. The scale ranges from 0 to 14. A neutral solution, such as pure water, has a pH of 7. An acid solution has a pH less than 7 and an alkaline solution has a pH greater than 7. The lower the pH below 7, the more acidic is the solution. Each whole-number decrease in pH represents a tenfold increase in acidity.

The pH of a solution is given by
where x represents the concentration of the hydrogen ions in the solution, in moles per liter. Use the formula to solve Exercises 119-120, Express answers as powers of 10.
a. Normal, unpolluted rain has a pH of about 5.6. What is the hydrogen ion concentration?
b. An environmental concern involves the destructive effects of acid rain. The most acidic rainfall ever had a pH of 2.4. What was the hydrogen ion concentration?
c. How many times greater is the hydrogen ion concentration of the acidic rainfall in part (b) than the normal rainfall in part (a)?
Want to see the full answer?
Check out a sample textbook solution
Chapter 4 Solutions
Algebra and Trigonometry (6th Edition)
- show that v3 = (−√3, −3, 3)⊤ is an eigenvector of M3 . Also here find the correspondingeigenvalue λ3 . Just from looking at M3 and its components, can you say something about the remaining twoeigenvalues? If so, what would you say? find v42 so that v4 = ( 2/5, v42, 1)⊤ is an eigenvector of M4 with corresp. eigenvalue λ4 = 45arrow_forwardChapter 4 Quiz 2 As always, show your work. 1) FindΘgivencscΘ=1.045. 2) Find Θ given sec Θ = 4.213. 3) Find Θ given cot Θ = 0.579. Solve the following three right triangles. B 21.0 34.6° ca 52.5 4)c 26° 5) A b 6) B 84.0 a 42° barrow_forwardQ1: A: Let M and N be two subspace of finite dimension linear space X, show that if M = N then dim M = dim N but the converse need not to be true. B: Let A and B two balanced subsets of a linear space X, show that whether An B and AUB are balanced sets or nor. Q2: Answer only two A:Let M be a subset of a linear space X, show that M is a hyperplane of X iff there exists ƒ€ X'/{0} and a € F such that M = (x = x/f&x) = x}. fe B:Show that every two norms on finite dimension linear space are equivalent C: Let f be a linear function from a normed space X in to a normed space Y, show that continuous at x, E X iff for any sequence (x) in X converge to Xo then the sequence (f(x)) converge to (f(x)) in Y. Q3: A:Let M be a closed subspace of a normed space X, constract a linear space X/M as normed space B: Let A be a finite dimension subspace of a Banach space X, show that A is closed. C: Show that every finite dimension normed space is Banach space.arrow_forward
- • Plane II is spanned by the vectors: P12 P2 = 1 • Subspace W is spanned by the vectors: W₁ = -- () · 2 1 W2 = 0arrow_forwardThree streams - Stream A, Stream B, and Stream C - flow into a lake. The flow rates of these streams are not yet known and thus to be found. The combined water inflow from the streams is 300 m³/h. The rate of Stream A is three times the combined rates of Stream B and Stream C. The rate of Stream B is 50 m³/h less than half of the difference between the rates of Stream A and Stream C. Find the flow rates of the three streams by setting up an equation system Ax = b and solving it for x. Provide the values of A and b. Assuming that you get to an upper-triangular matrix U using an elimination matrix E such that U = E A, provide also the components of E.arrow_forwarddent Application X GA spinner is divided into five cox | + 9/26583471/4081d162951bfdf39e254aa2151384b7 A spinner is divided into five colored sections that are not of equal size: red, blue, green, yellow, and purple. The spinner is spun several times, and the results are recorded below: Spinner Results Color Frequency Red 5 Blue 11 Green 18 Yellow 5 Purple 7 Based on these results, express the probability that the next spin will land on purple as a fraction in simplest form. Answer Attempt 1 out of 2 Submit Answer 0 Feb 12 10:11 Oarrow_forward
- A student completed the problem below. Identify whether the student was correct or incorrect. Explain your reasoning. (identification 1 point; explanation 1 point) 4x 3x (x+7)(x+5)(x+7)(x-3) 4x (x-3) (x+7)(x+5) (x03) 3x (x+5) (x+7) (x-3)(x+5) 4x²-12x-3x²-15x (x+7) (x+5) (x-3) 2 × - 27x (x+7)(x+5) (x-3)arrow_forward2 Add the rational expressions below. Can you add them in this original form? Explain why or why not. 3x-7 5x + x² - 7x+12 4x-12 Show all steps. State your least common denominator and explain in words your process on how you determined your least common denominator. Be sure to state your claim, provide your evidence, and provide your reasoning before submitting.arrow_forwardcarol mailed a gift box to her sister the boxed gift weighed a total of 2 pounds the box alone weighed 13 ounces what was the wright of the giftarrow_forward
 Functions and Change: A Modeling Approach to Coll...AlgebraISBN:9781337111348Author:Bruce Crauder, Benny Evans, Alan NoellPublisher:Cengage Learning
 Holt Mcdougal Larson Pre-algebra: Student Edition...AlgebraISBN:9780547587776Author:HOLT MCDOUGALPublisher:HOLT MCDOUGAL

